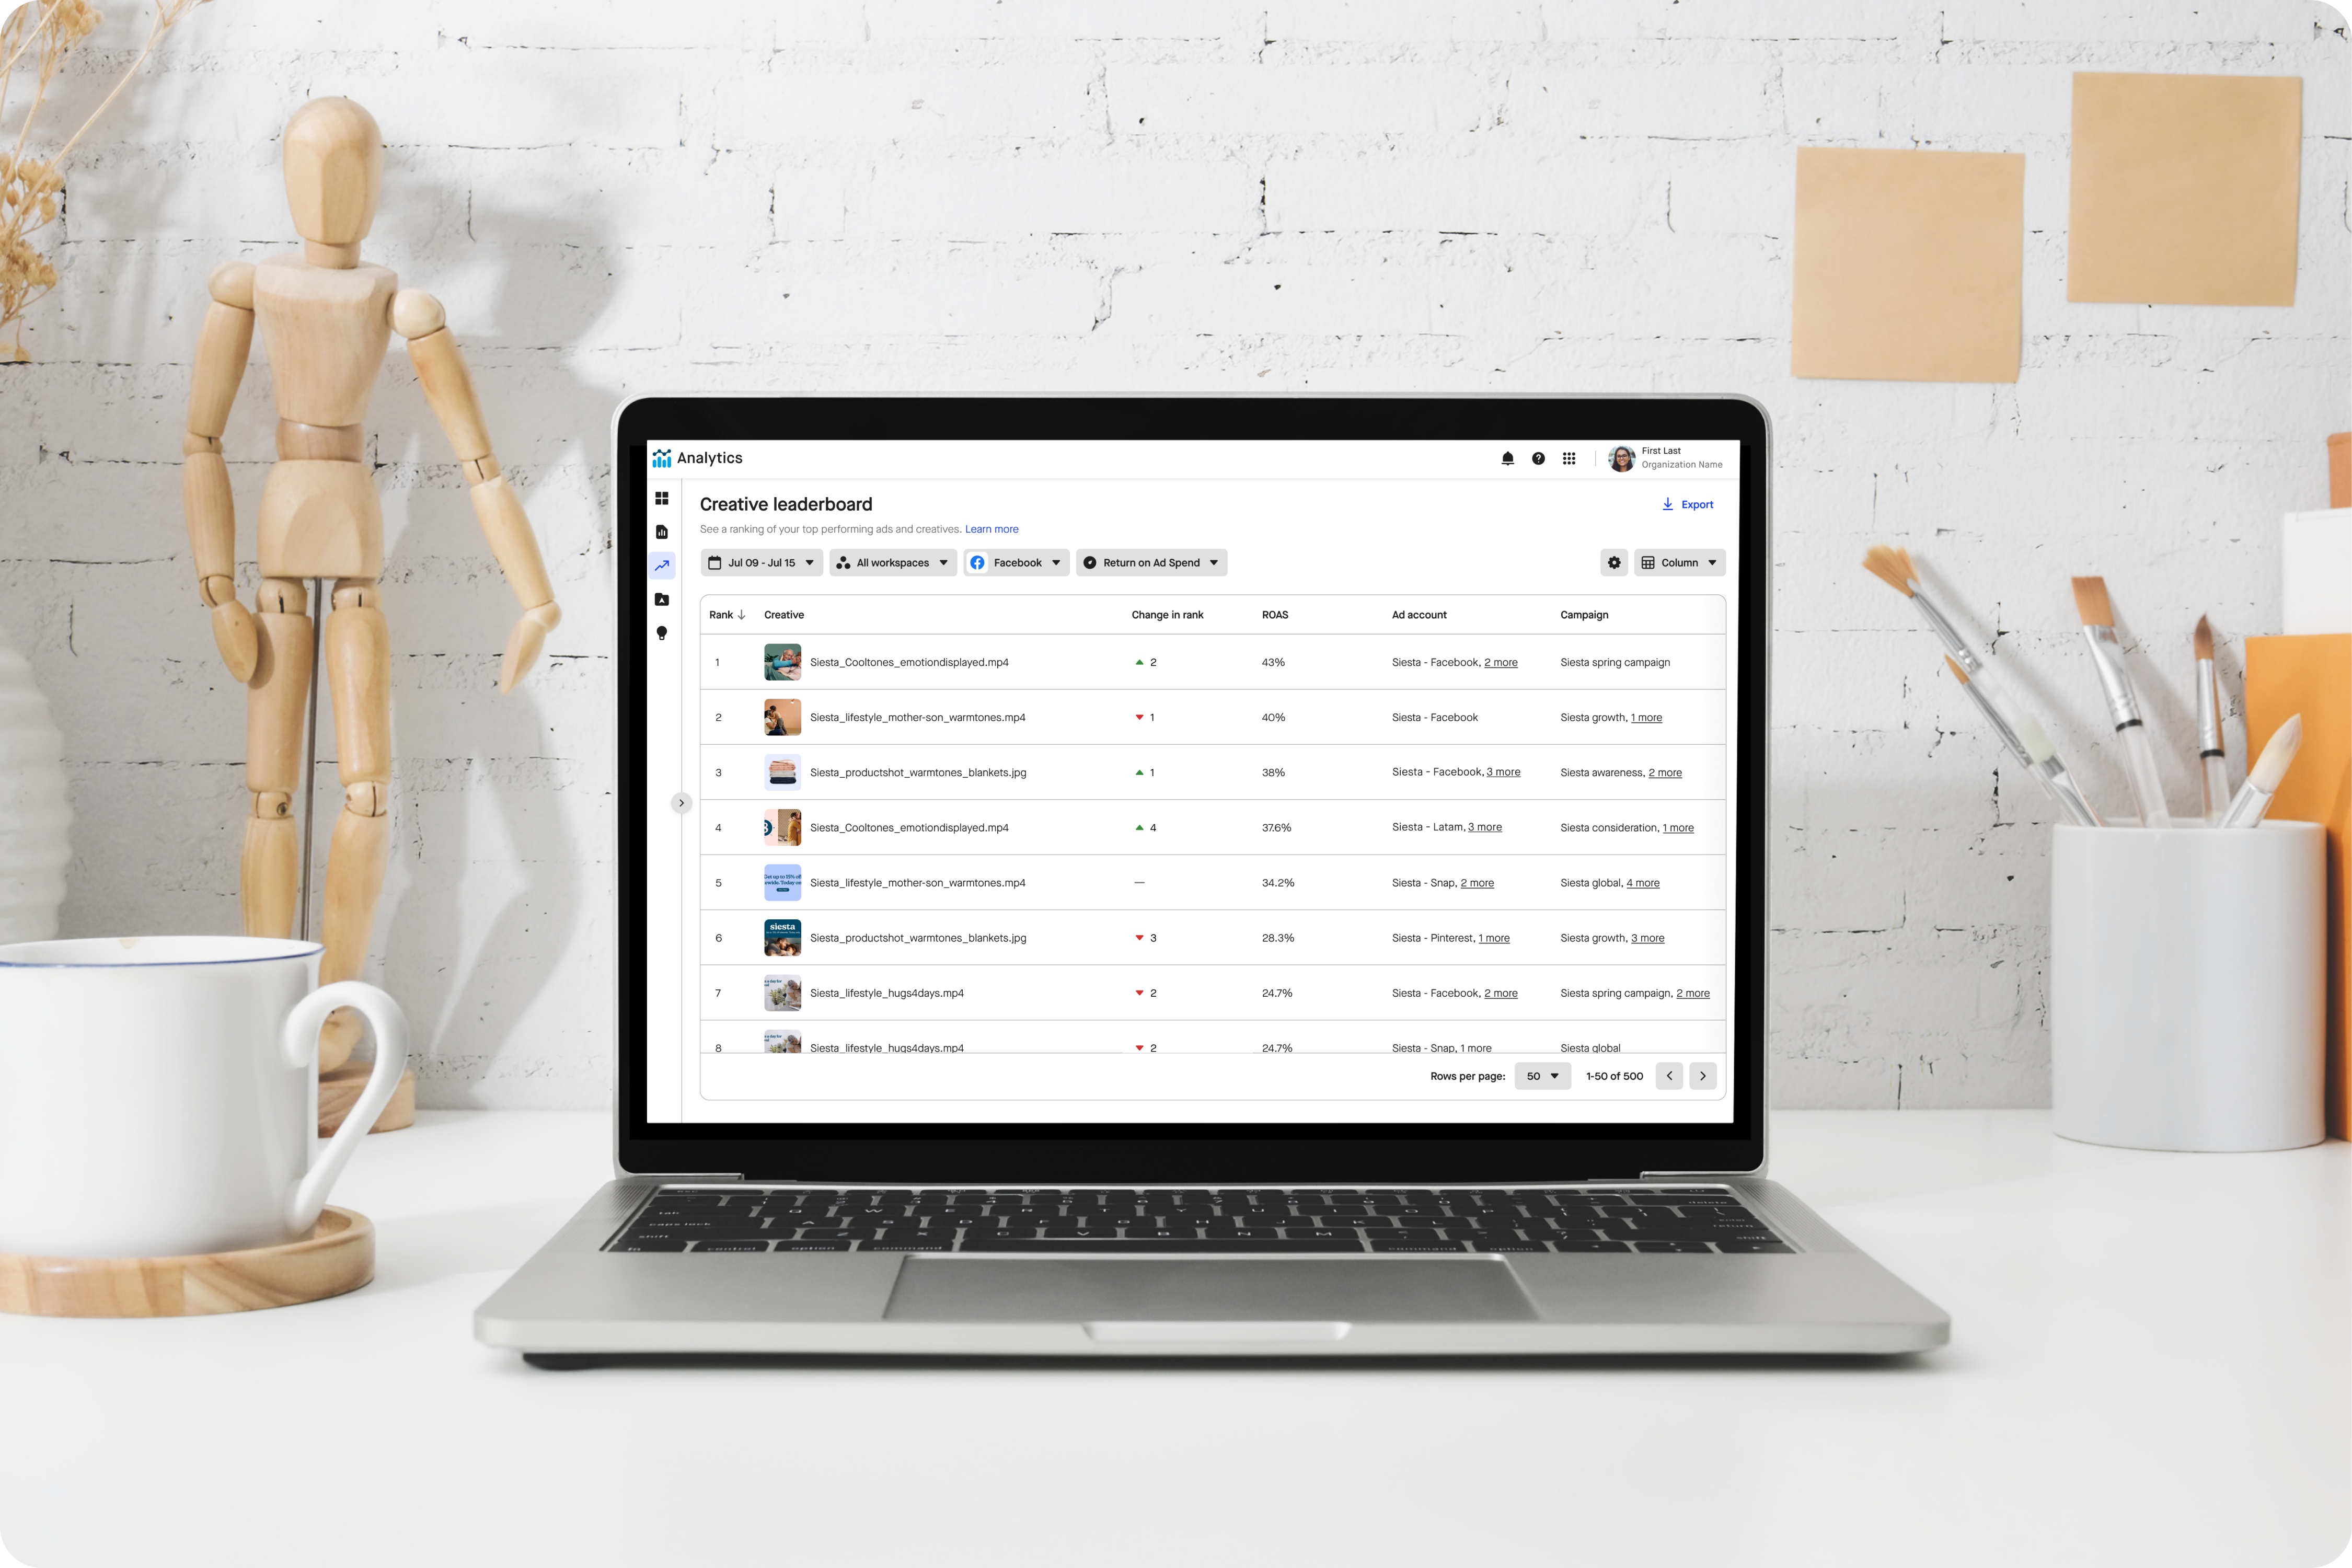
Problem:
Marketers and agencies with large portfolios of content need a way to quickly uncover high performing content across workspaces, channels and ad accounts. WPP and Coke came to us with a request to help them understand which content was performing best across multiple ad accounts and channels in relation to the previous week.
Objective:
Create a view within analytics that spans the entirety of the organization and allows users to get a read on top performing content globally to understand performance and trends. As well as the ability to understand which content isn't performing well and may be in need of a refresh.
Process:
This was a client deliverable with an abbreviated timeline so after the initial breakout we allotted two weeks for design so engineering had enough time ahead of the final client deadline. Because of this we didn't do any user testing and went straight into design. This was our first initiative where we were going to implement our new MUI library for both the design and the implementation so coming into the project we knew we would be representing the data within a table but we iterated on the several variations before landing on the final simplified approach. Below are some initial iterations followed by the final designs.
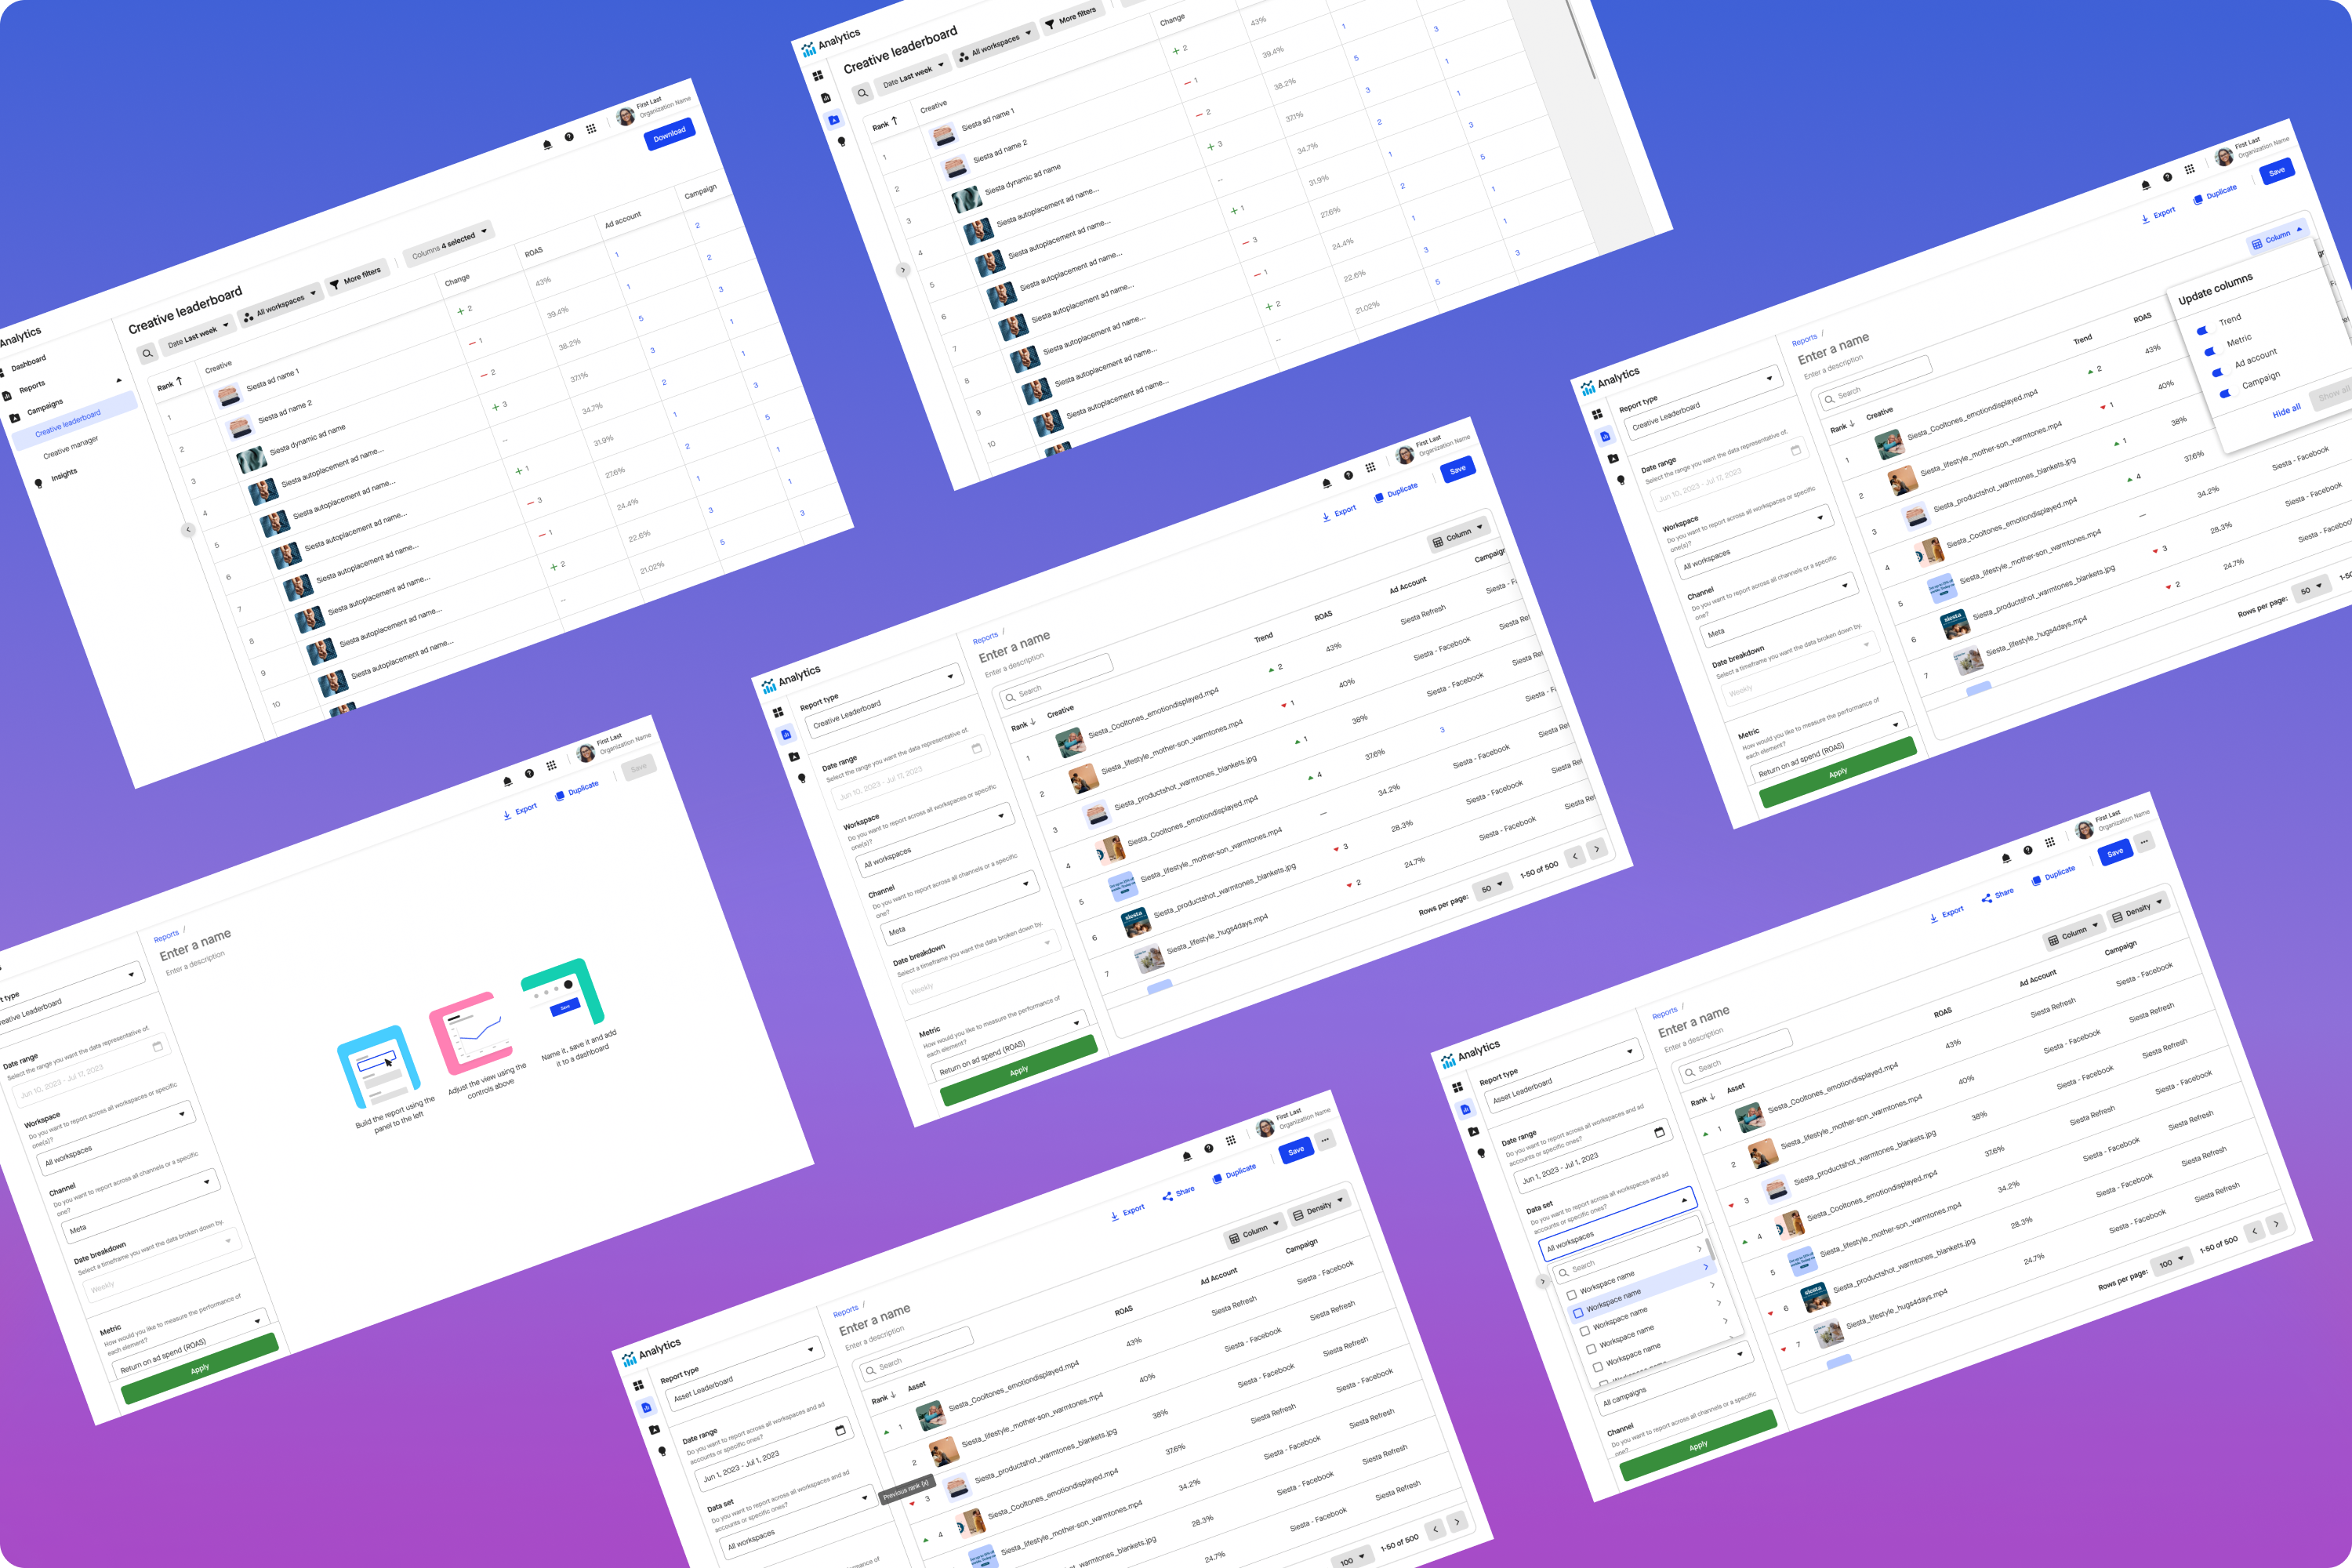
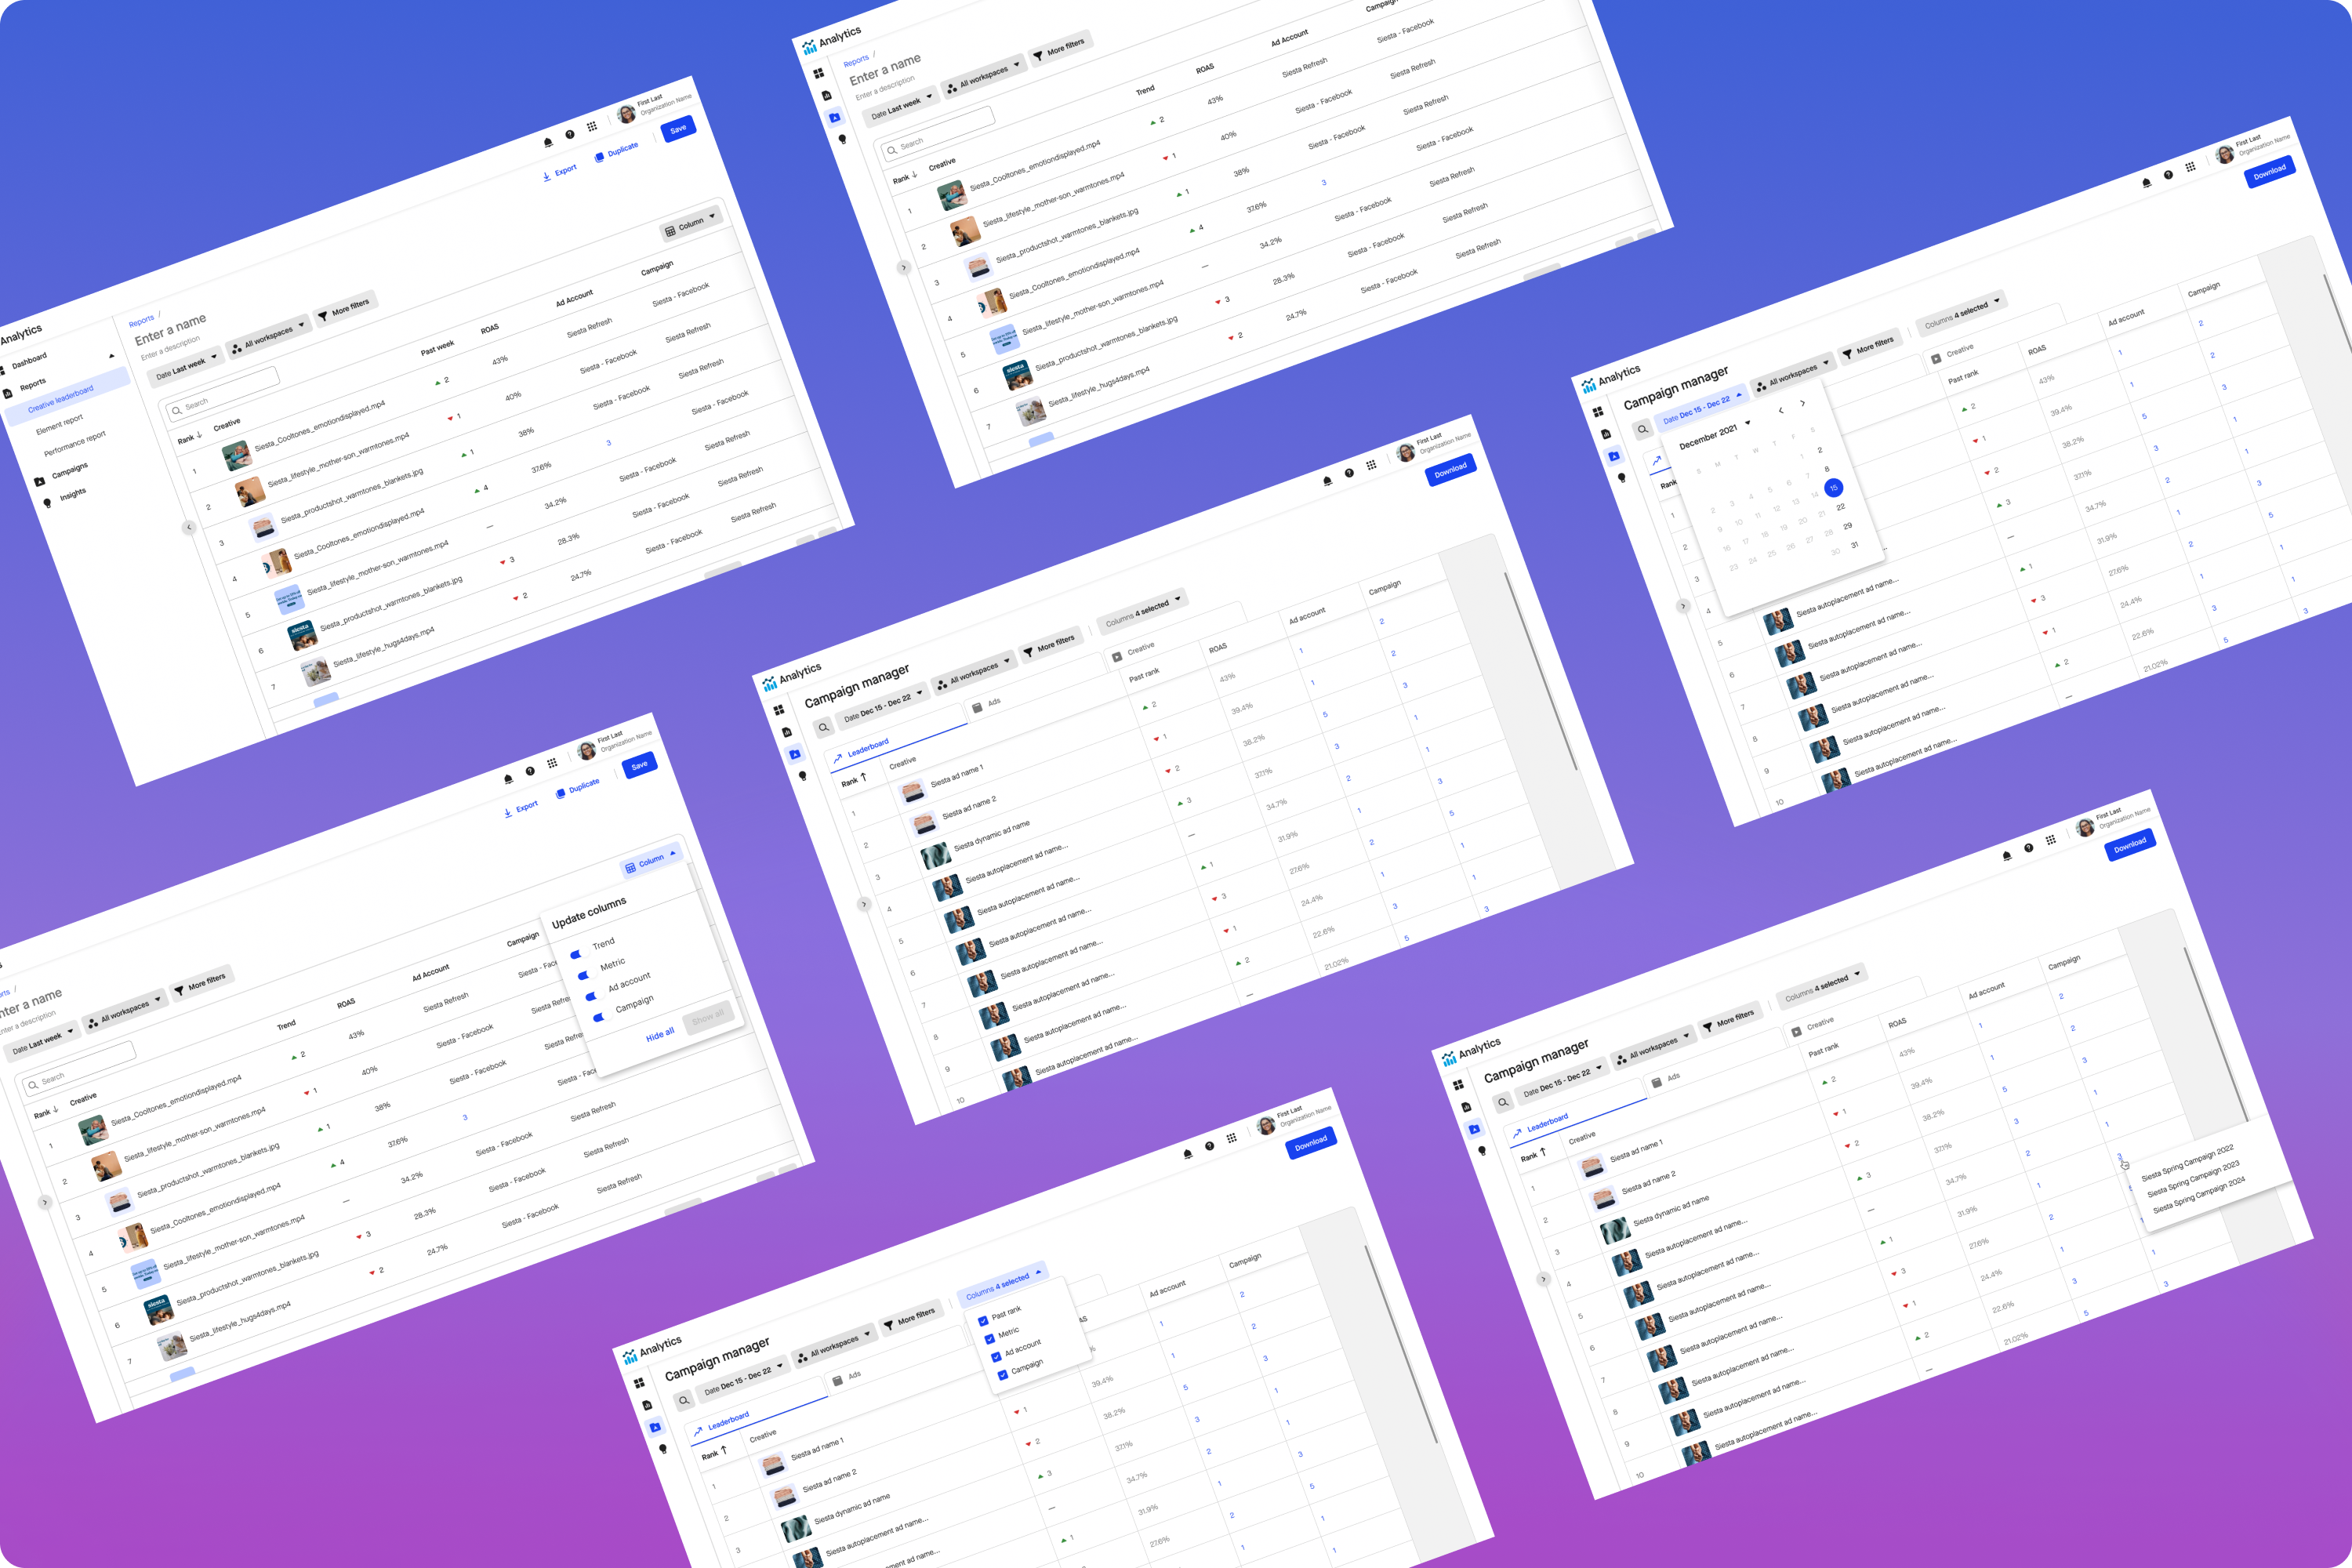
Iterations on final designs
Solution:
Based on a number of technical concerns implementing a new UI and a fixed deadline we decided to simplify the experience, and really make sure that users were able to digest the information in front of them. Instead of trying to add the table to an existing feature or introduce a new report building flow that allowed users more flexibility, we opted to add the leaderboard to the main navigation of analytics so it could be more easily introduced to users.
The interface itself was simplified down to a control bar with the primary actions on the page and a table to display the data. Since this project was focused on the change in performance of creative based on a single KPI across all channels, ad accounts, and workspaces we made the only ascendable or descendible column the rank and gave users the ability to hide other columns that may be of less importance to them. Upon clicking on a line item users were taken to a more detailed view of performance for each individual piece of creative. Due to how the data was structured coming back from the different channels users were able to select a single week of time in the calendar picker and the results were automatically compared to the previous 7 days.
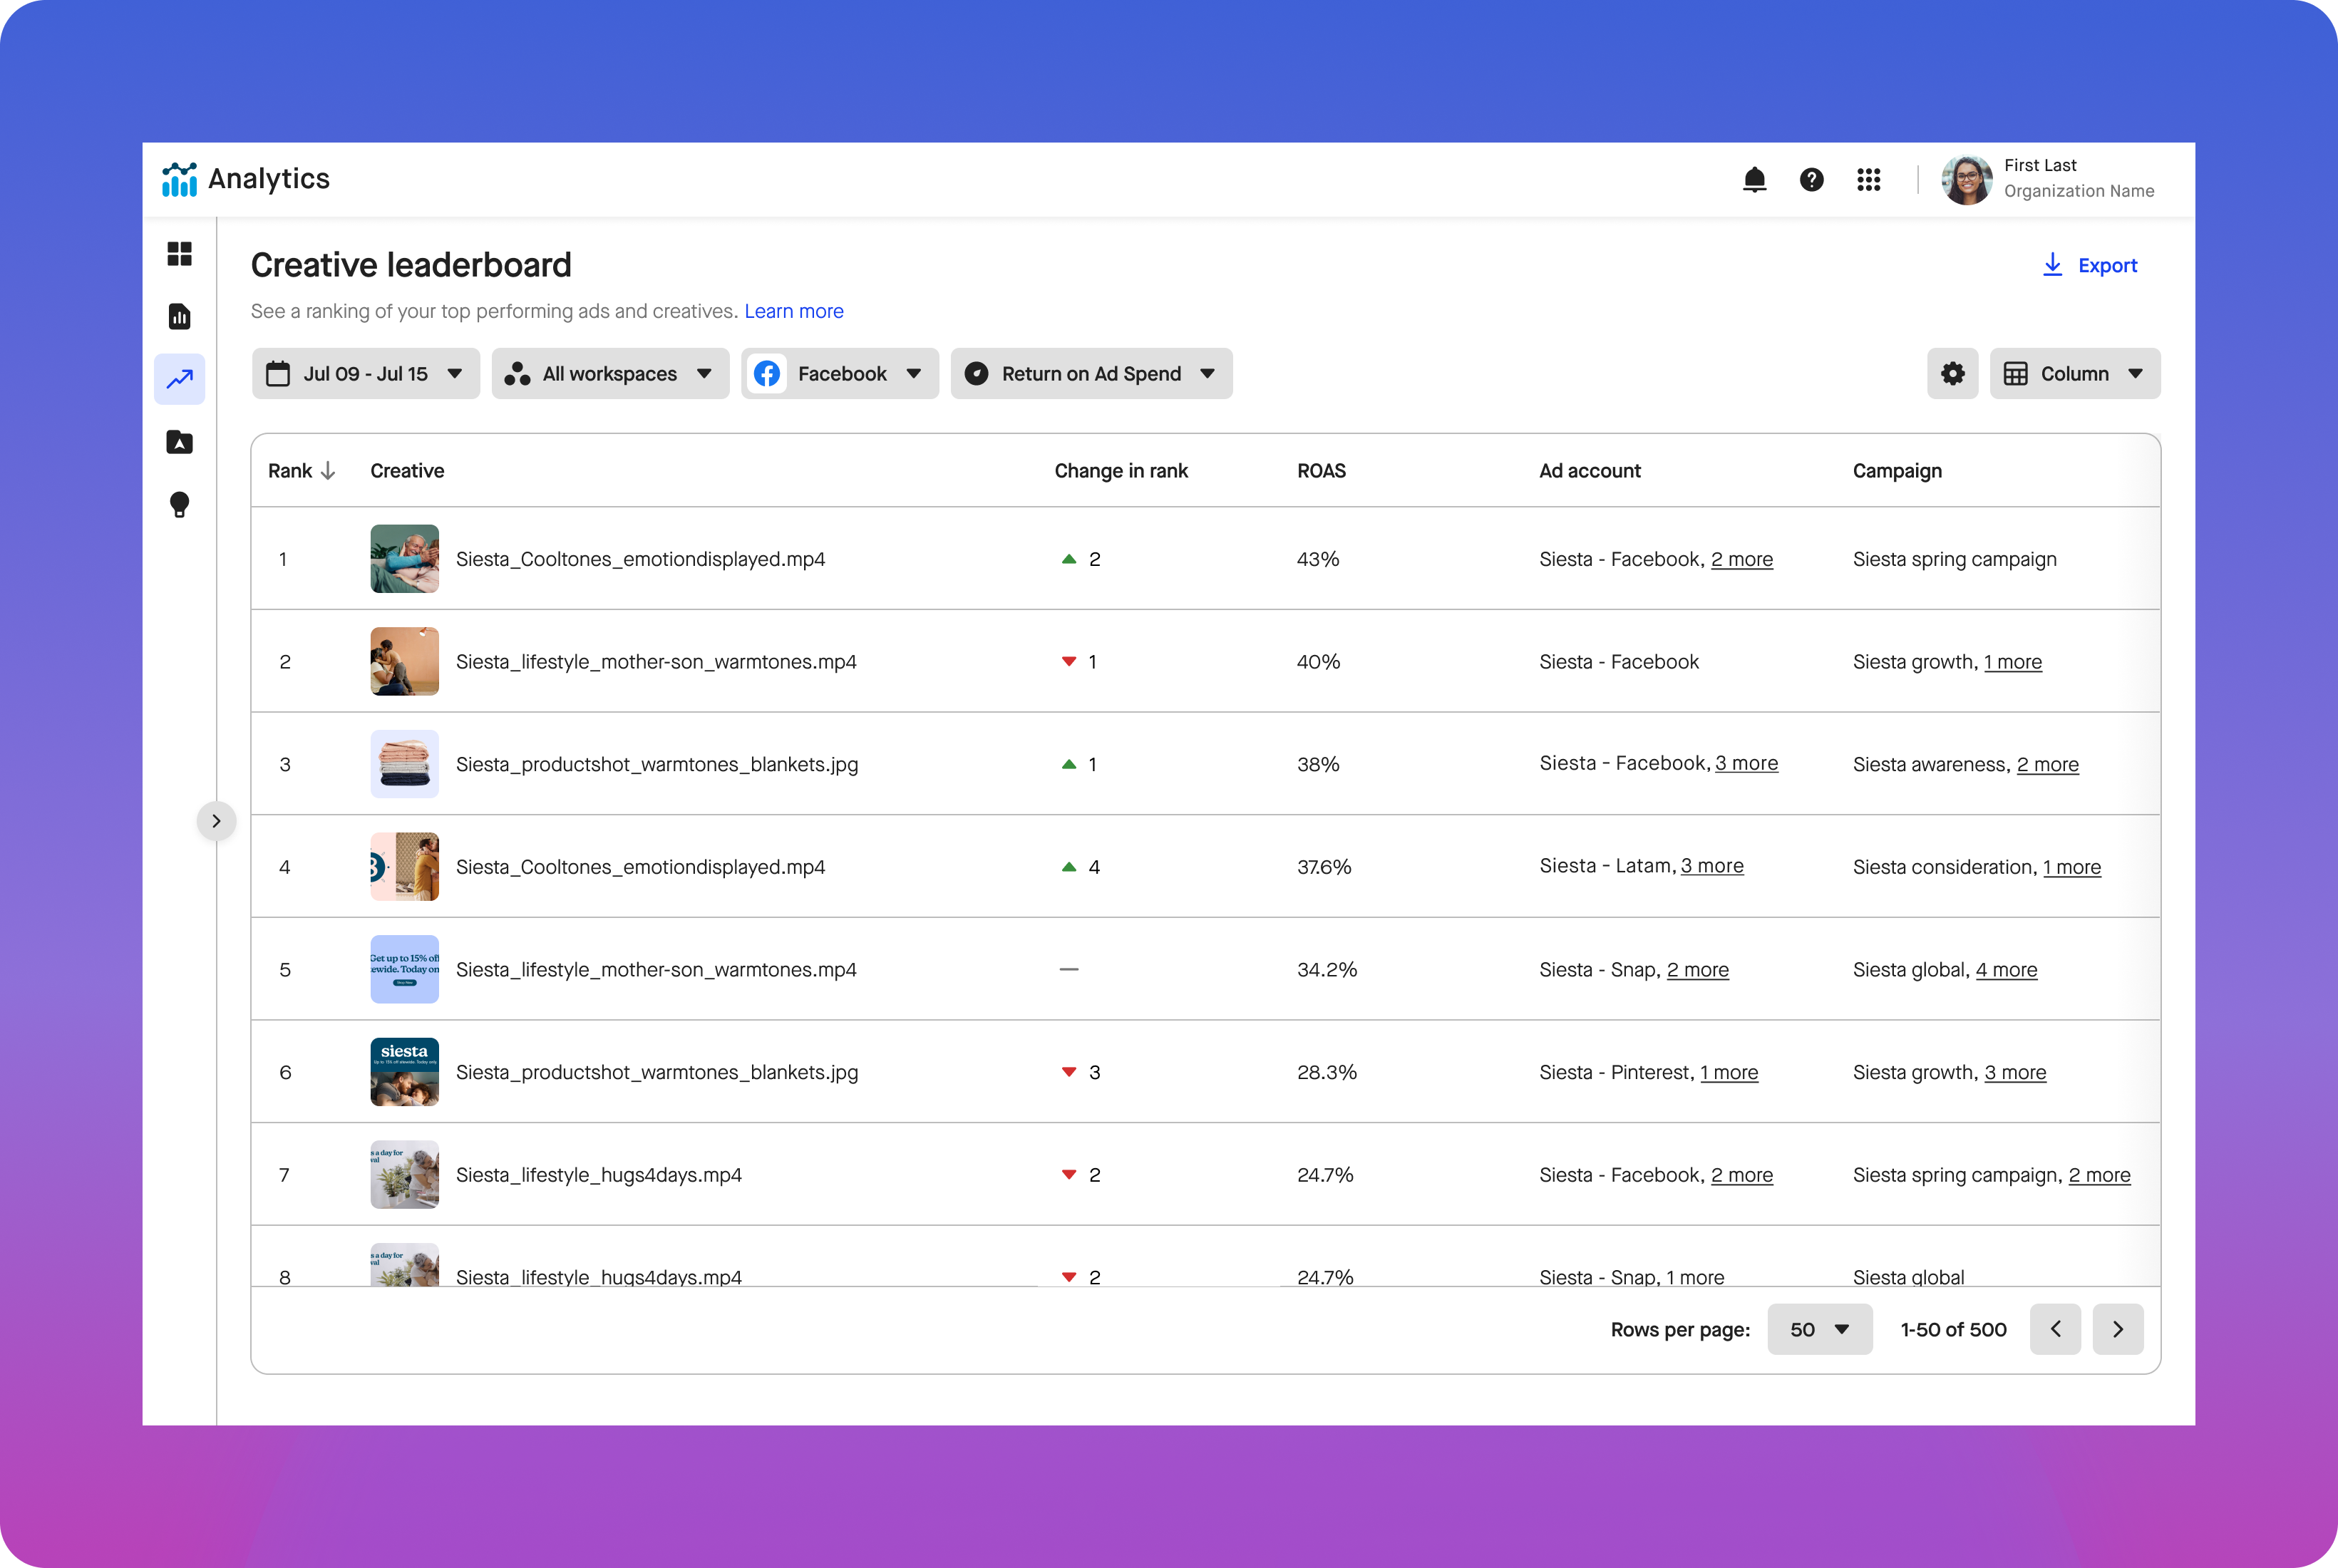
Creative leaderboard
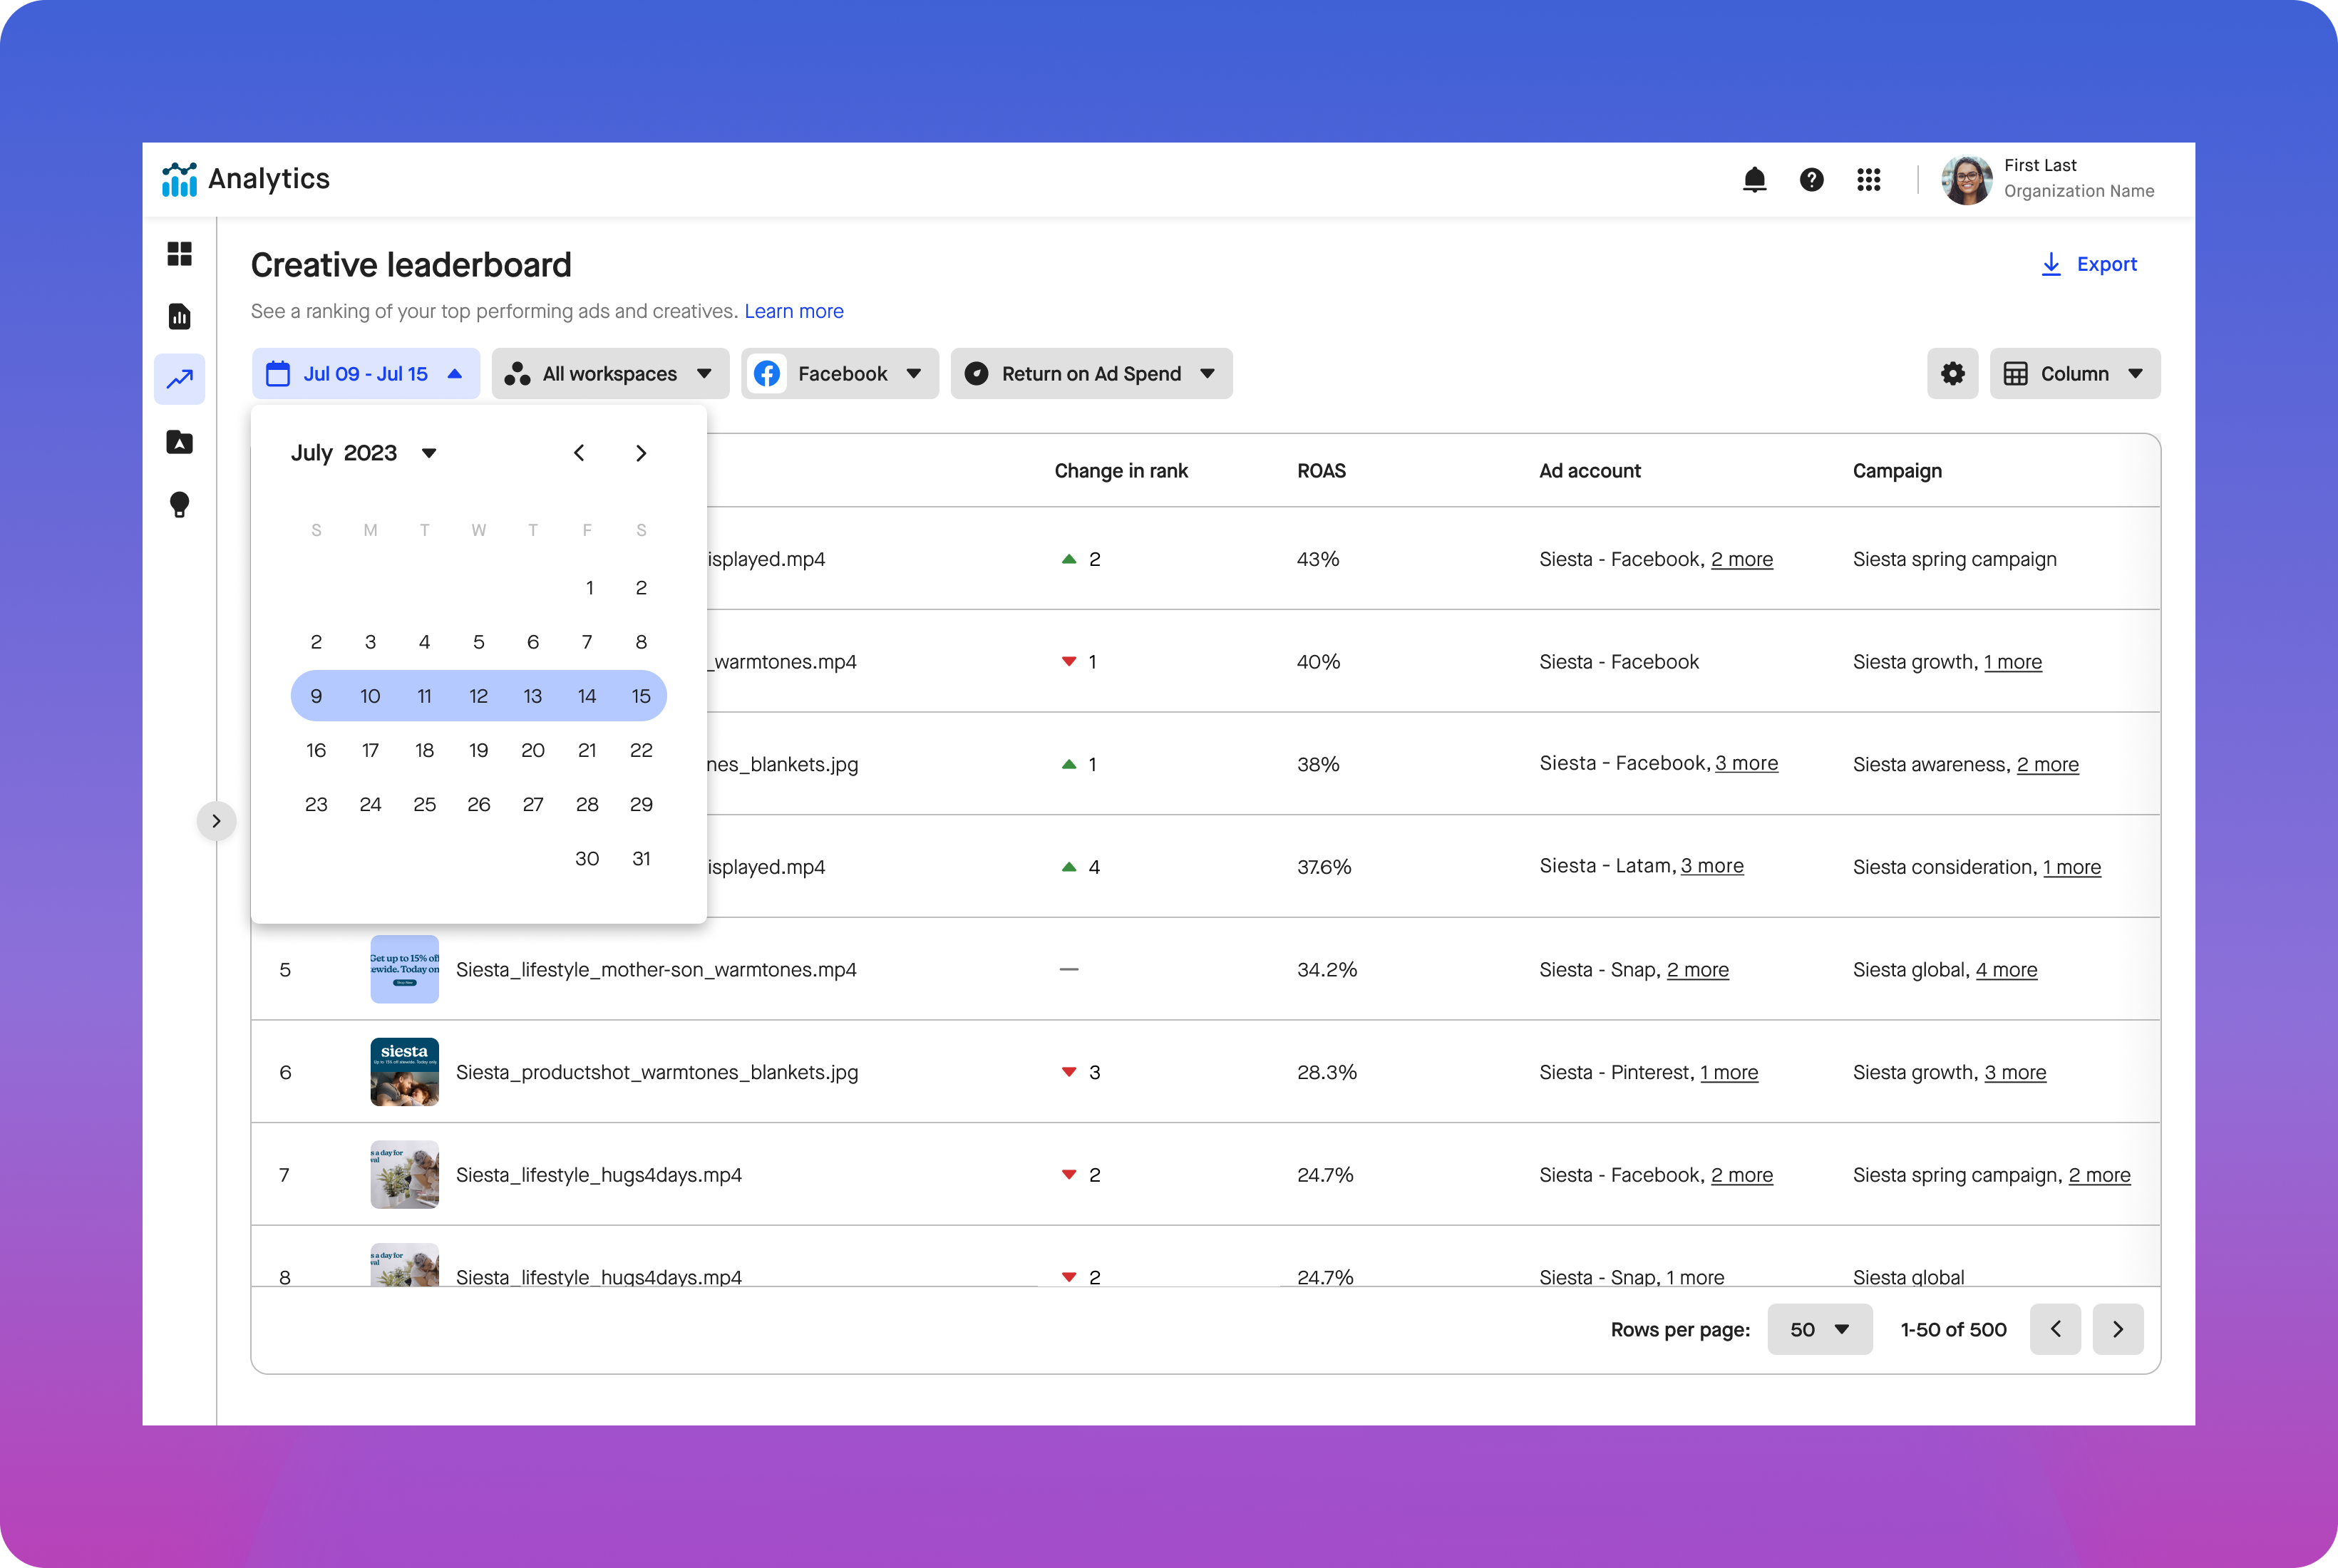
Calendar picker
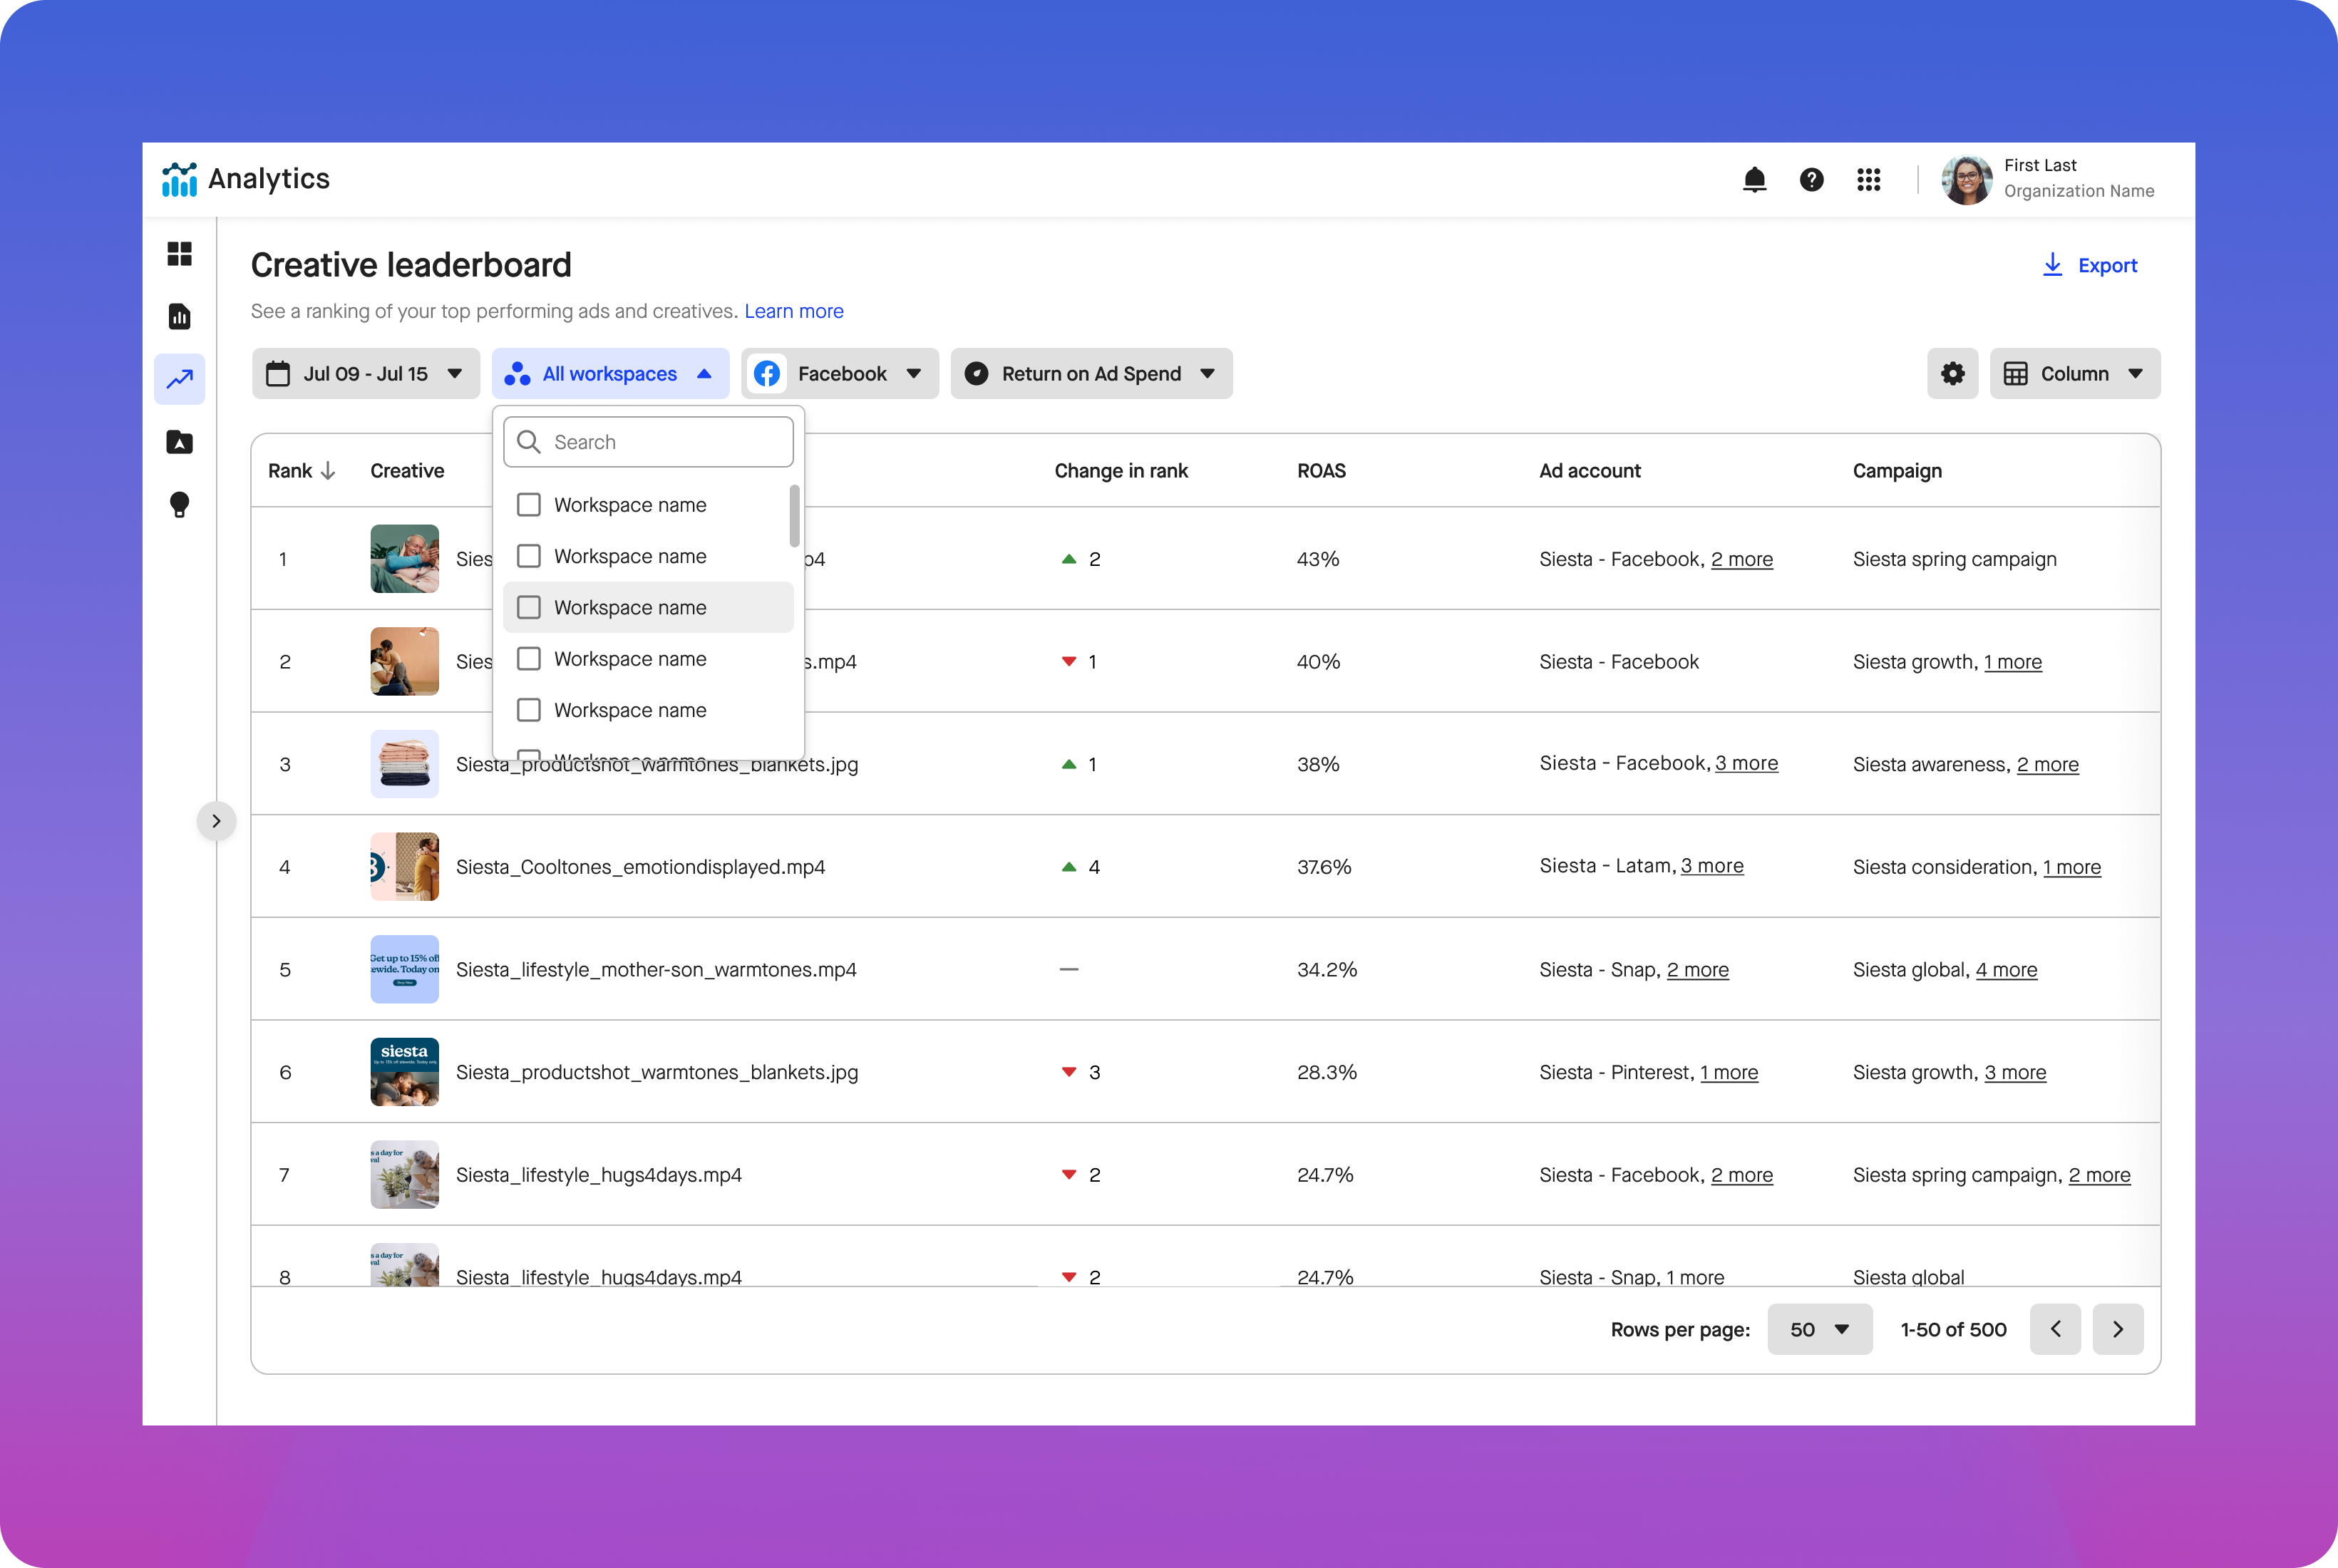
Workspace dropdown
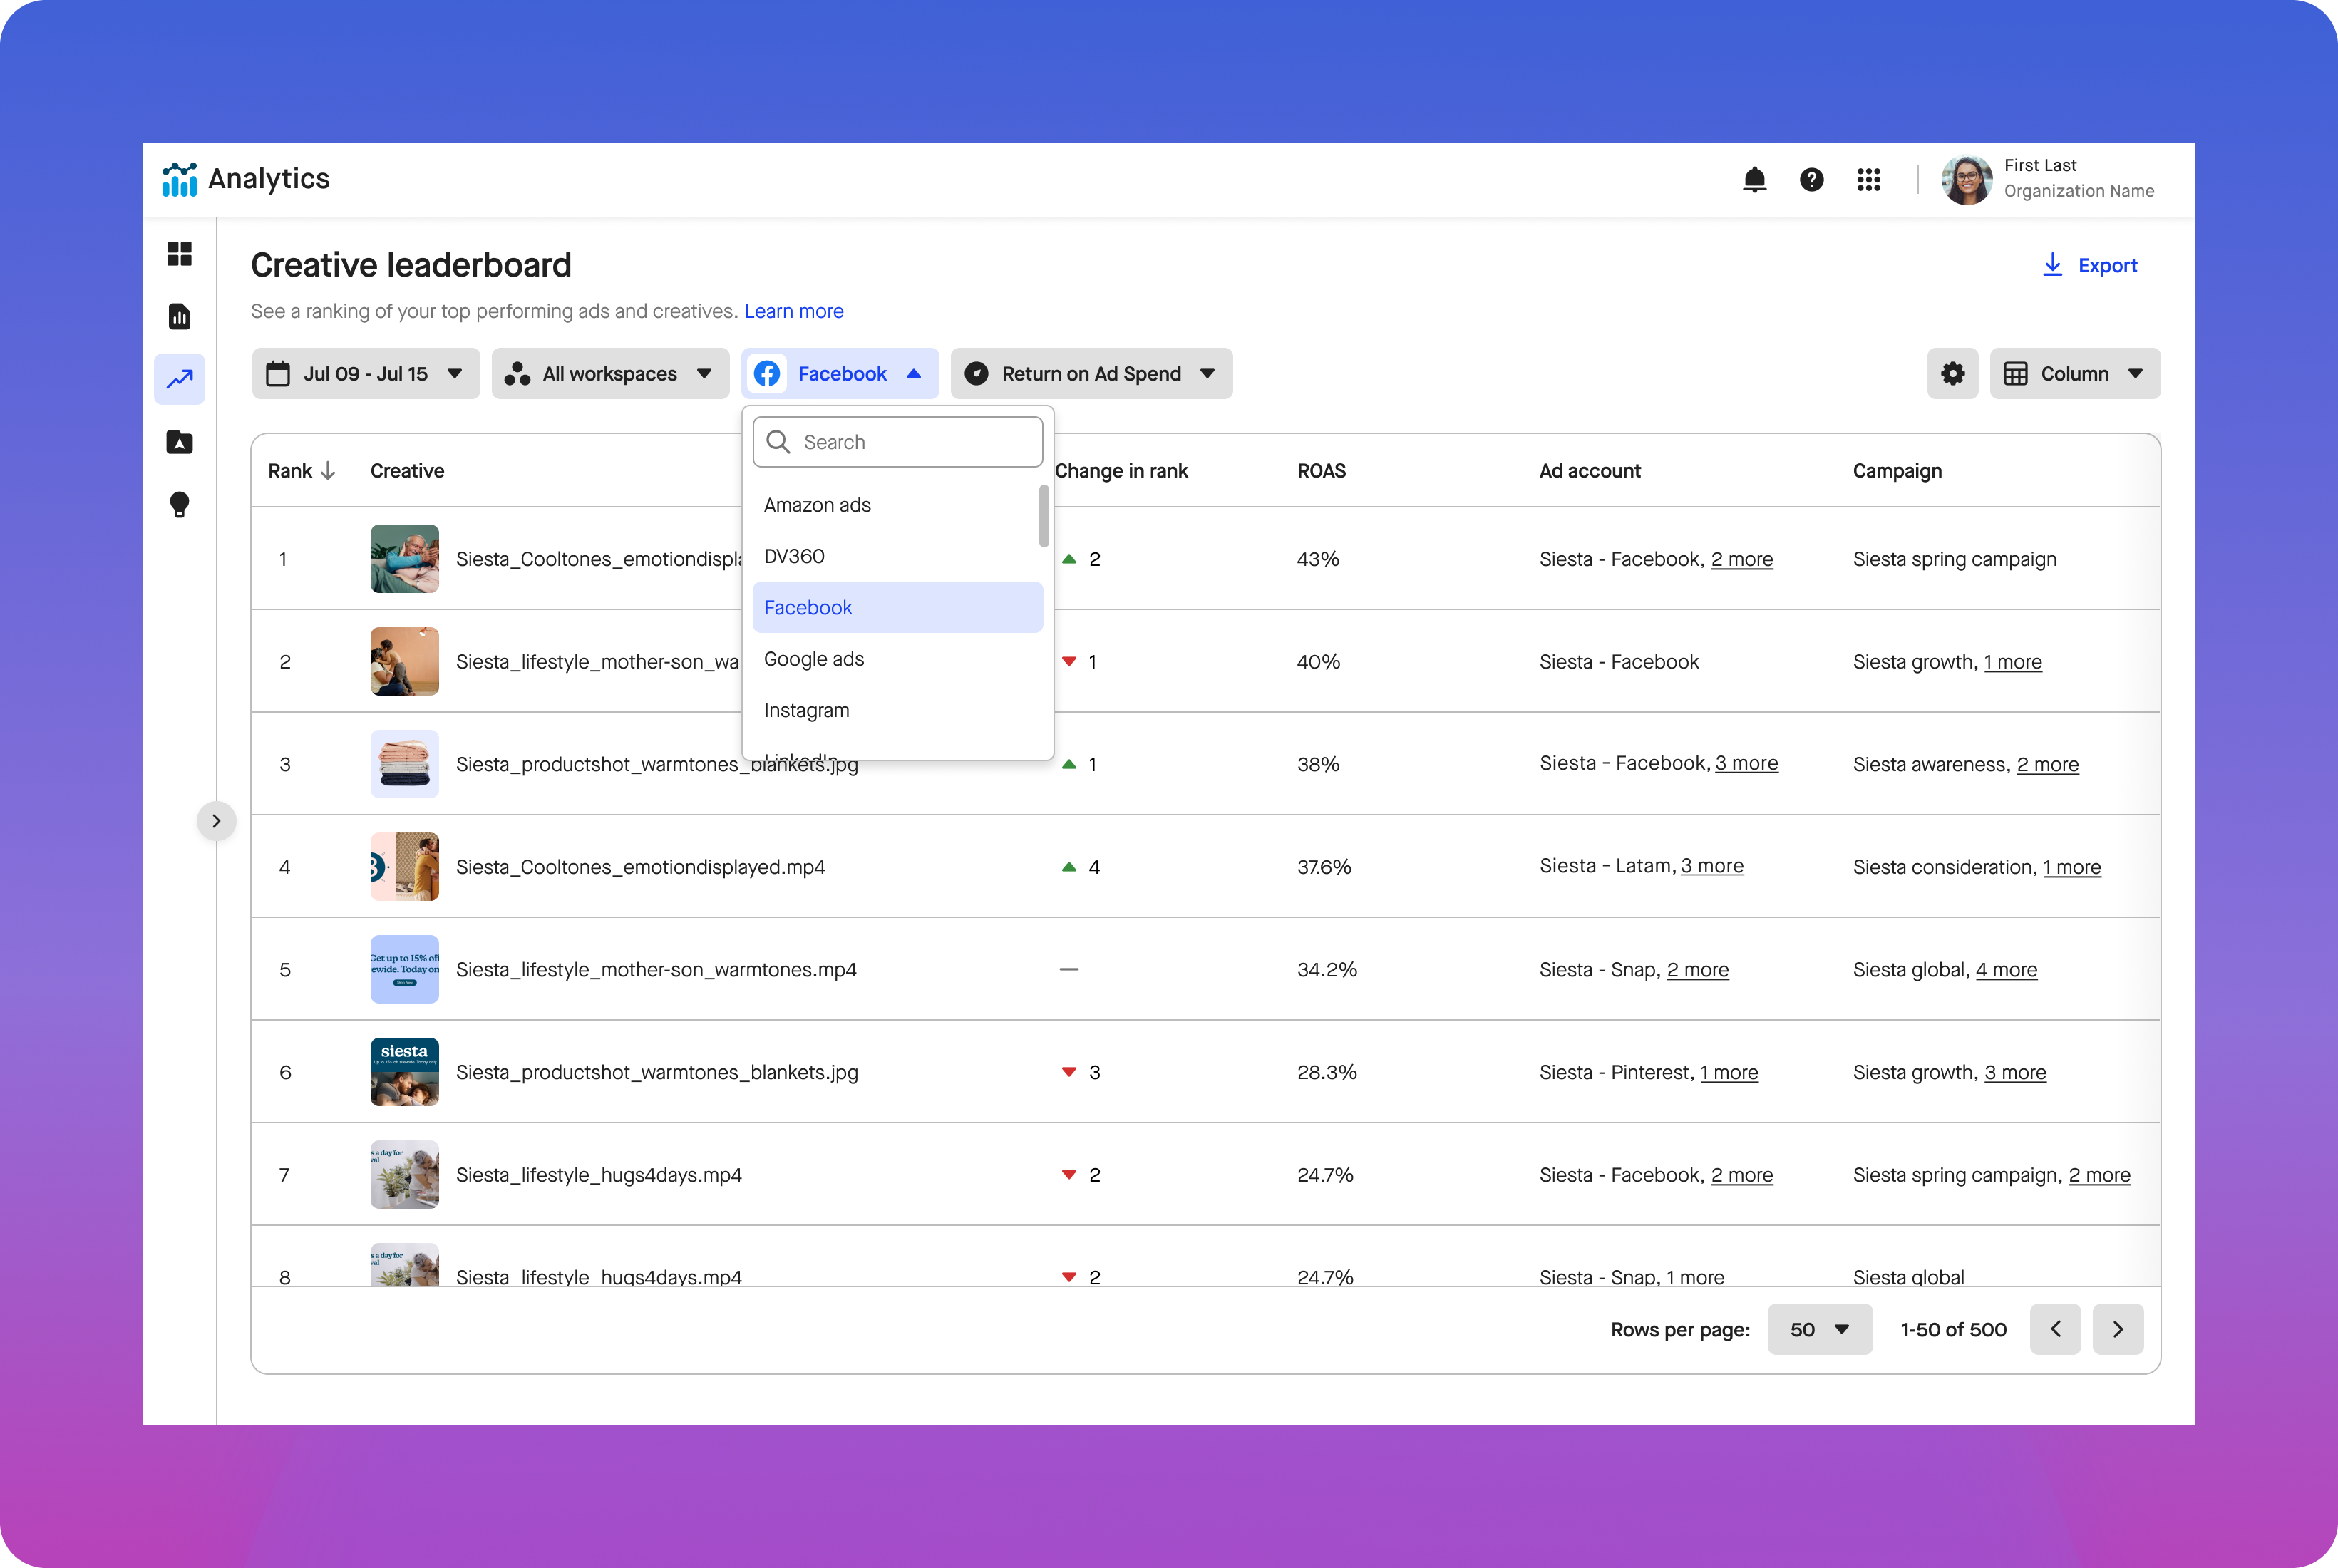
Channel dropdown
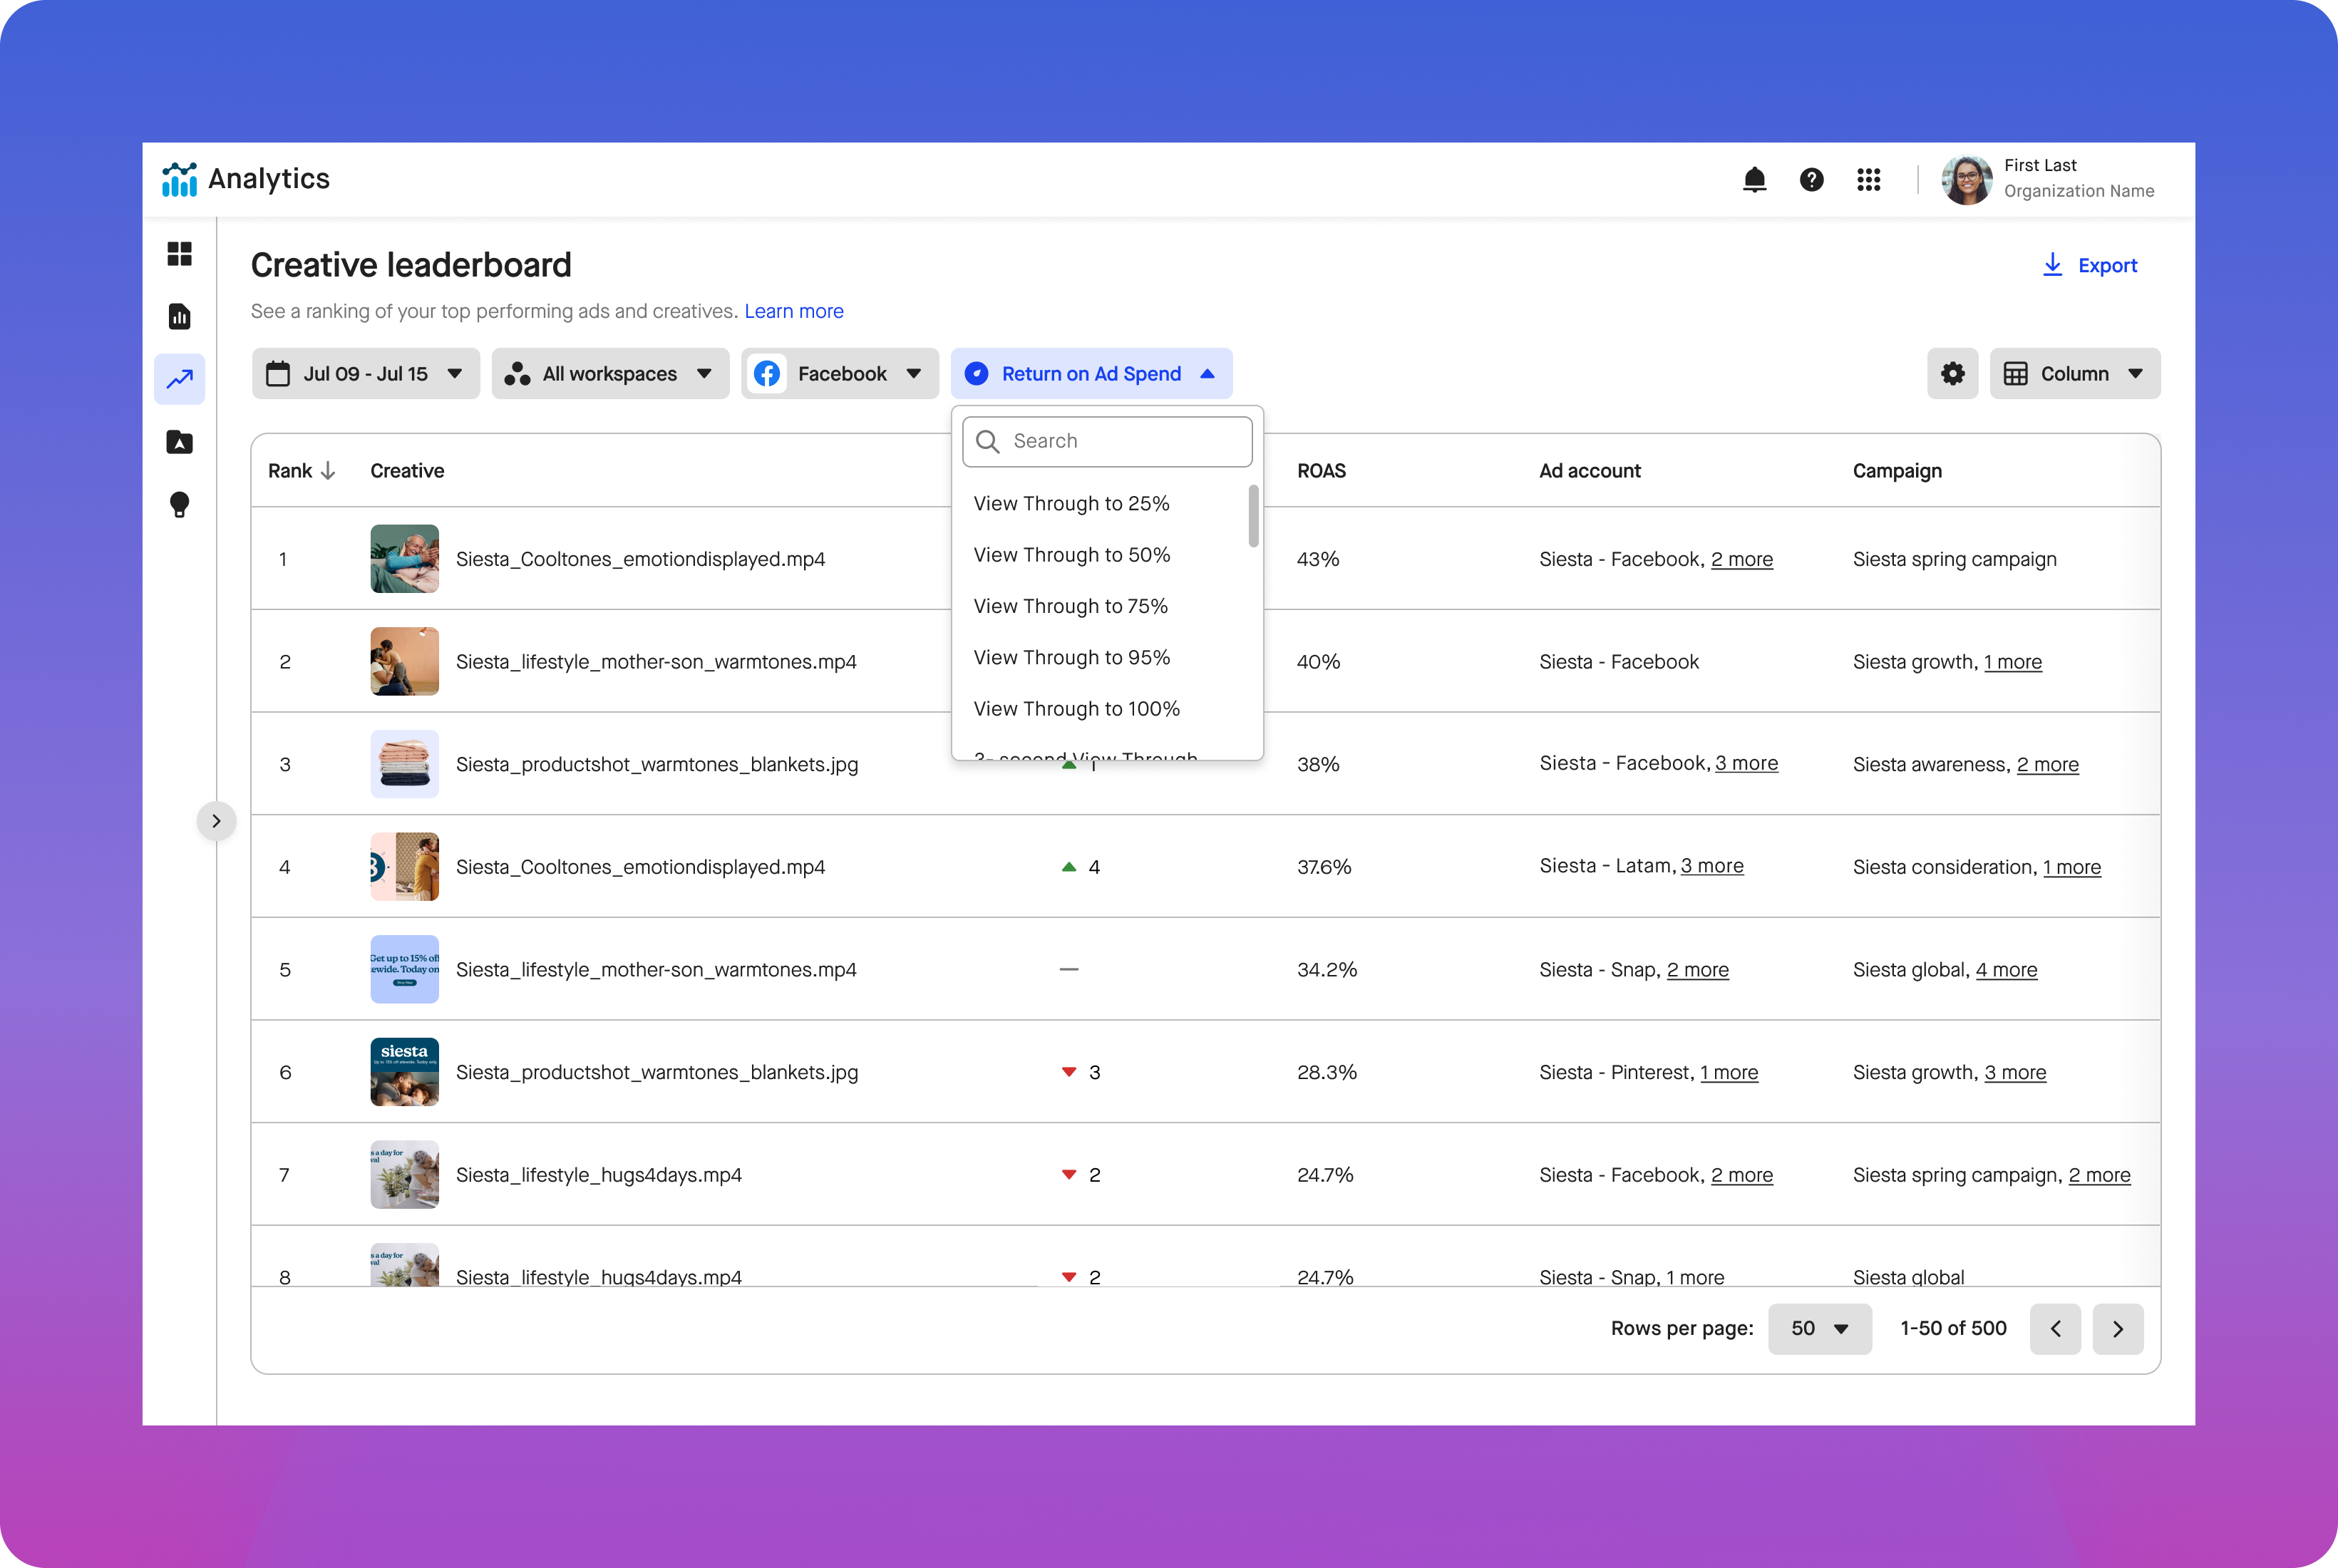
KPI dropdown
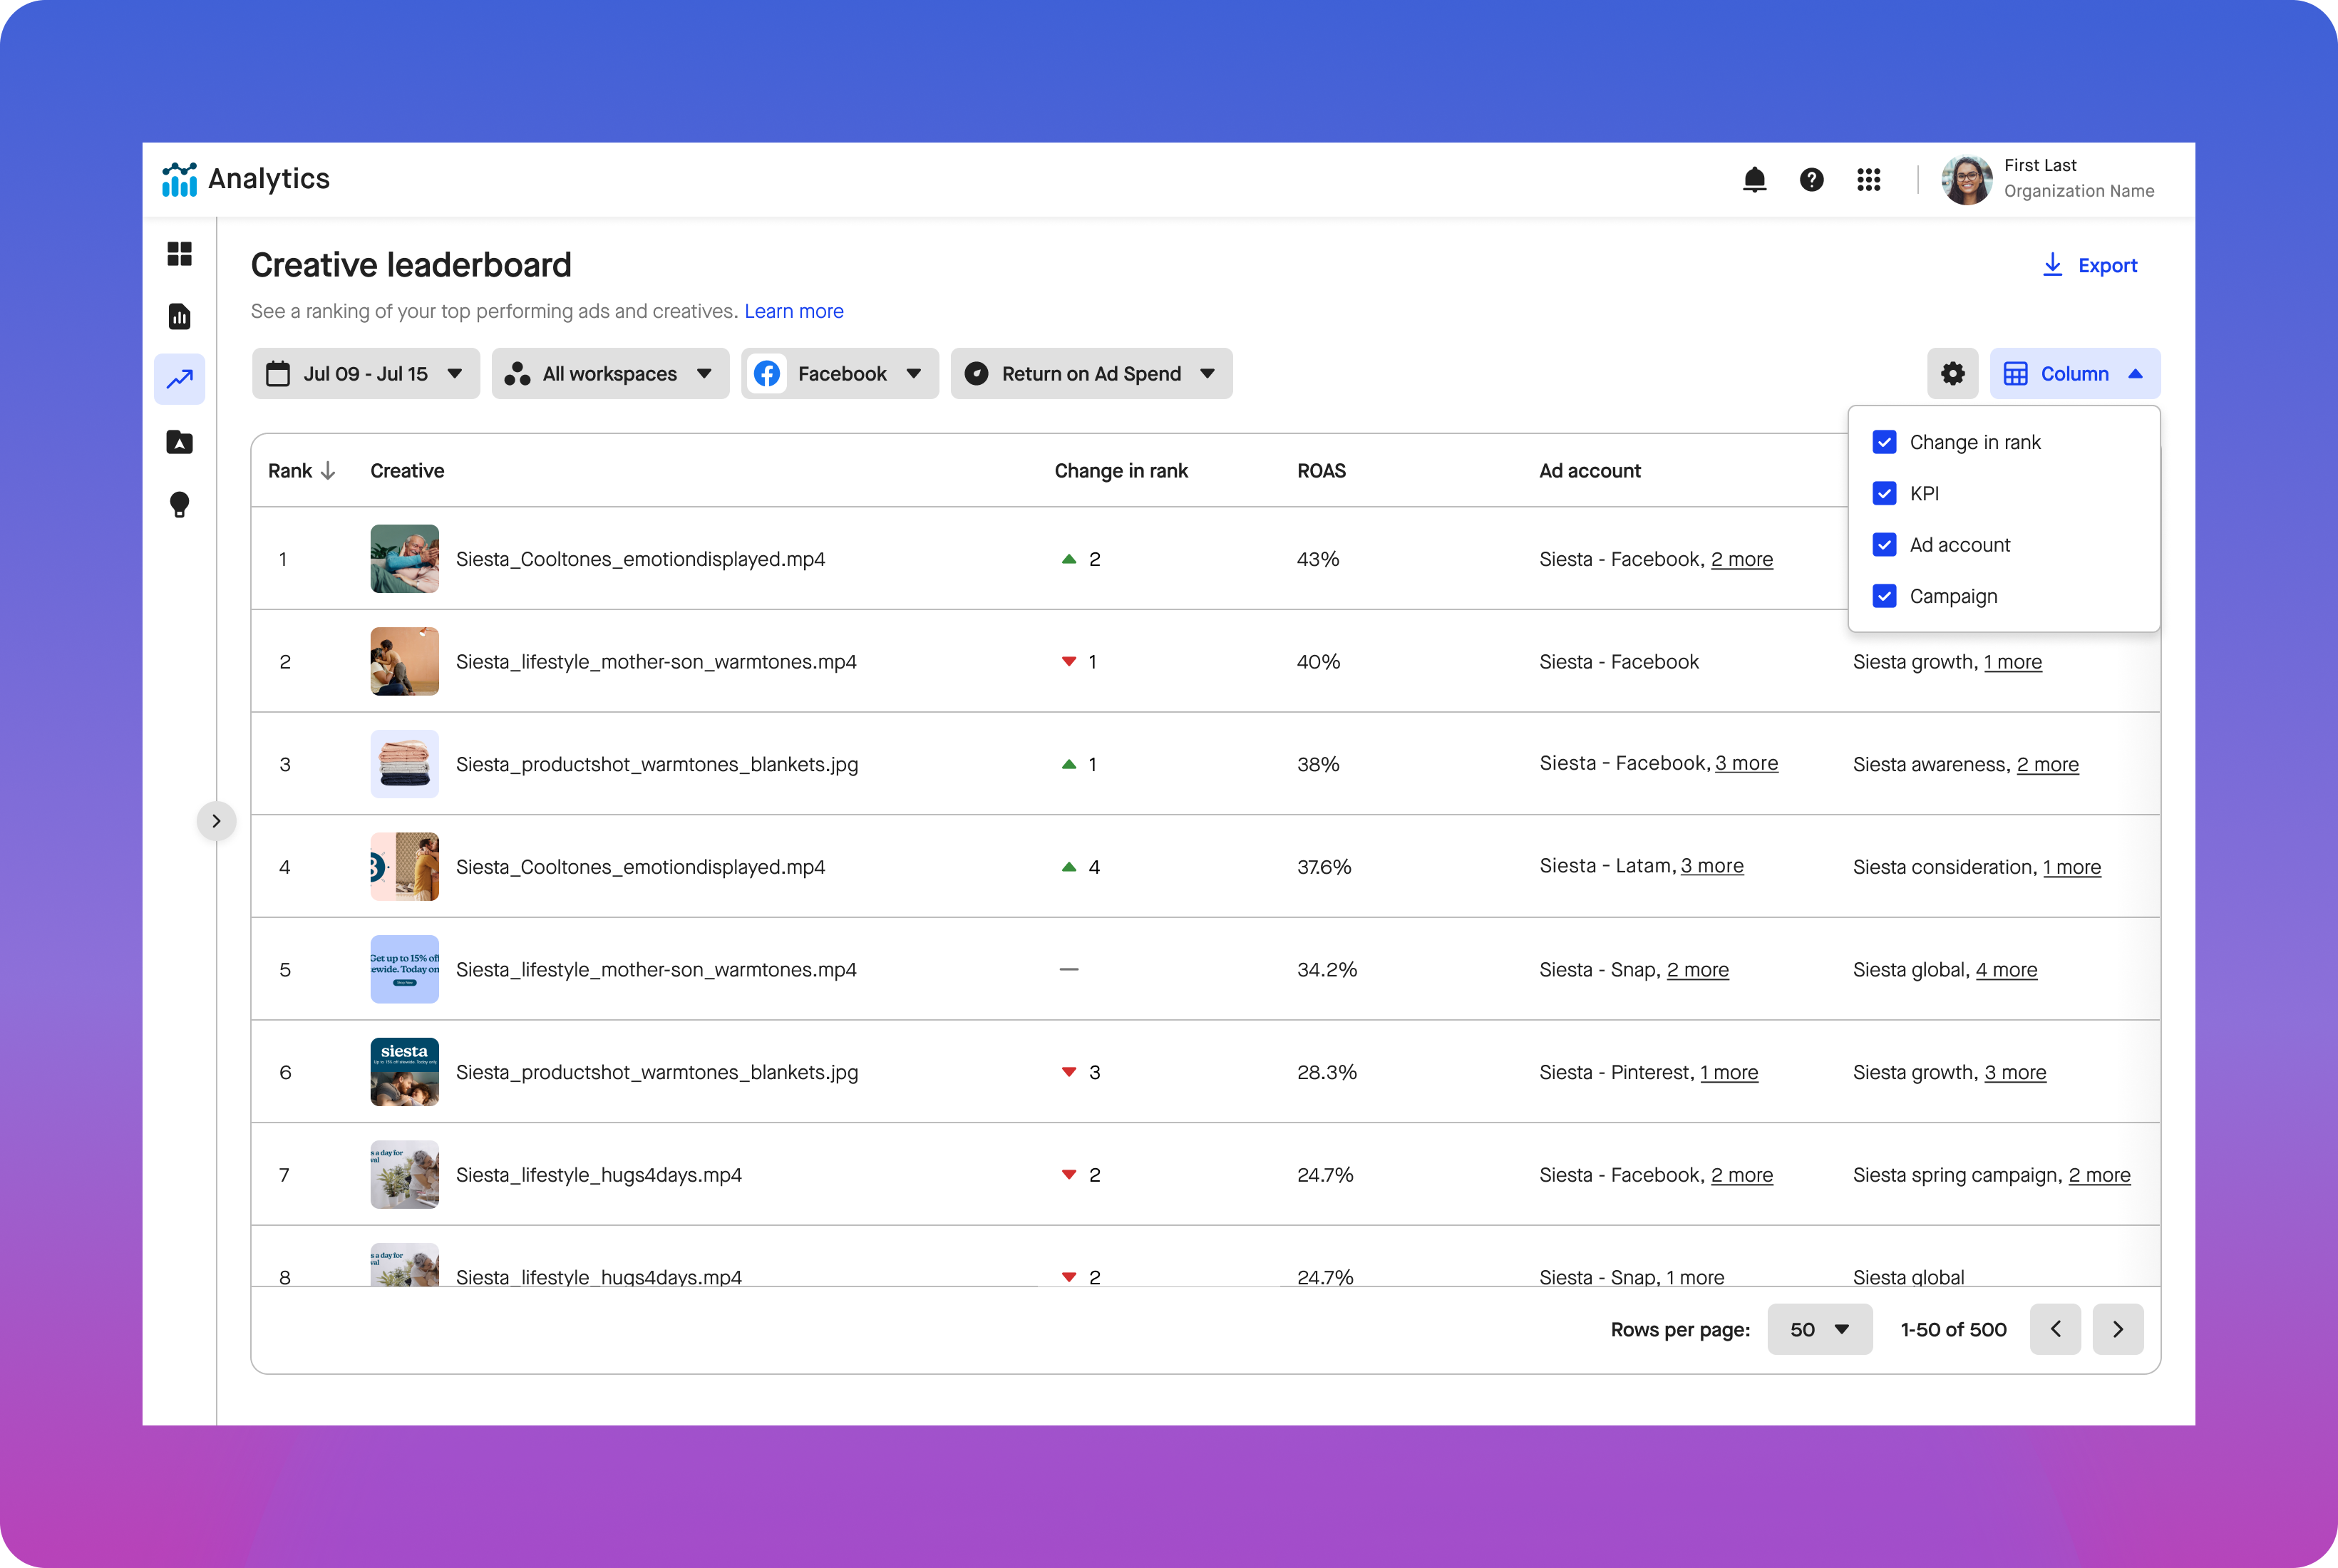
Column dropdown
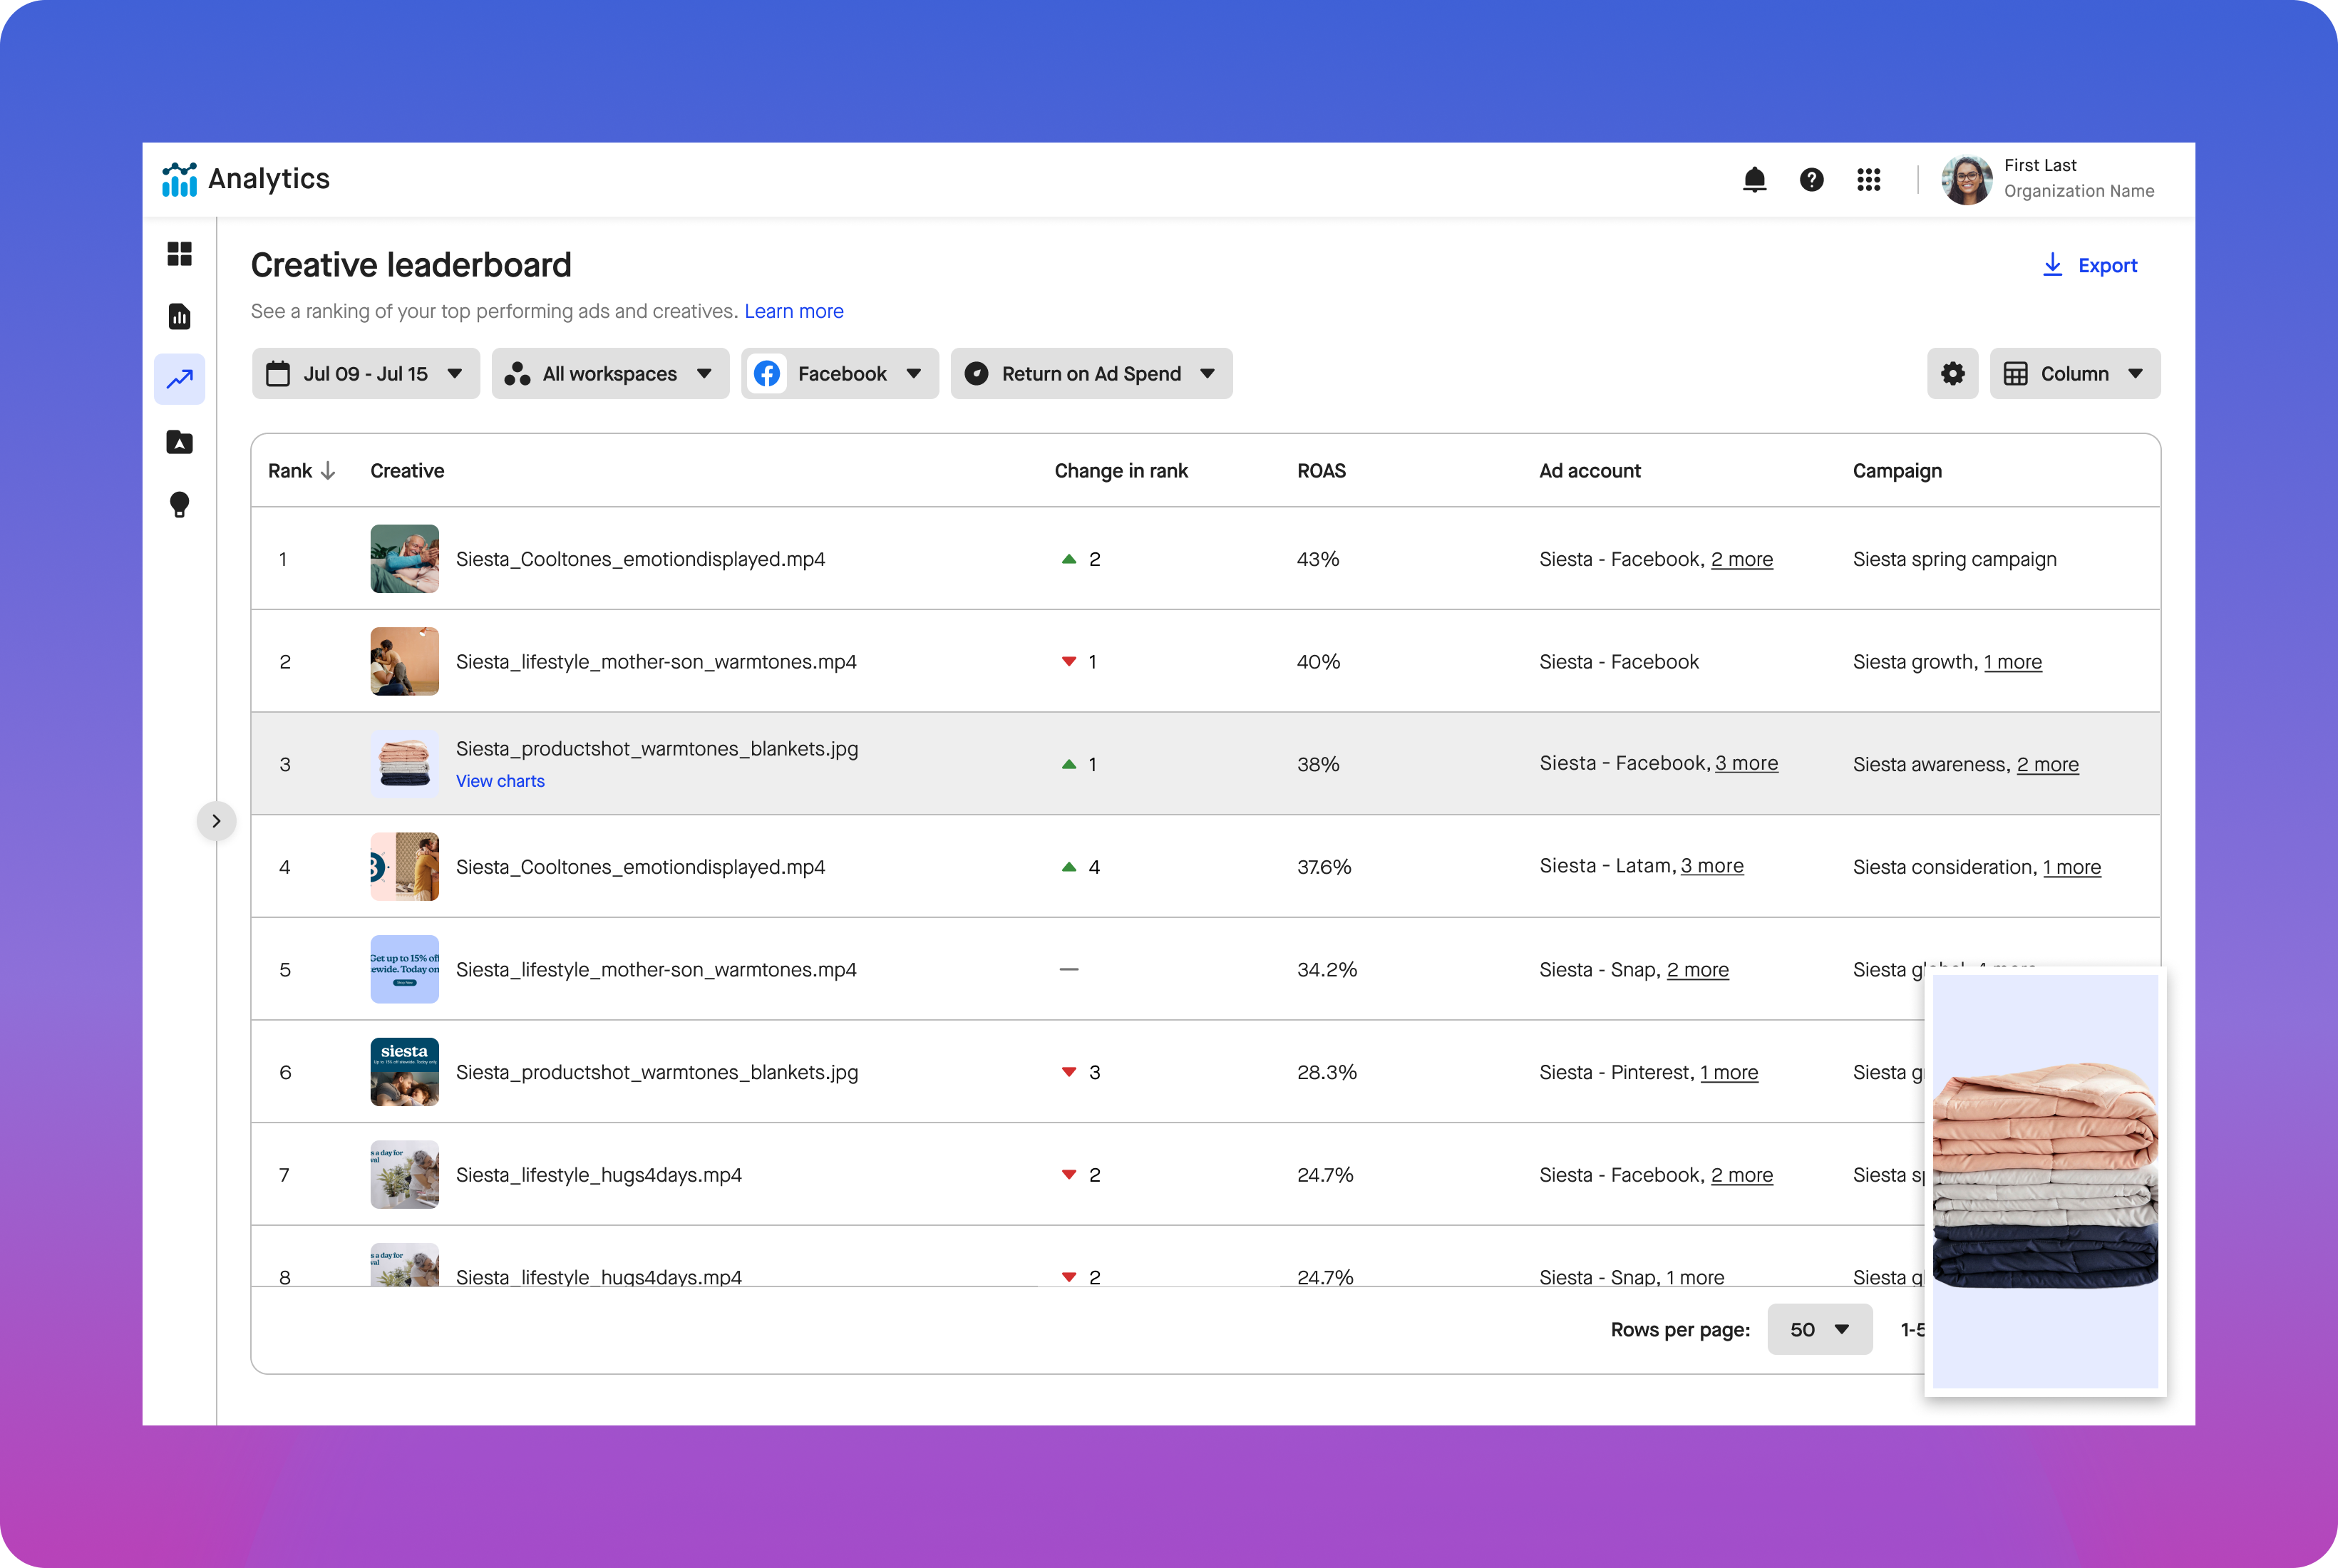
Line item hover state
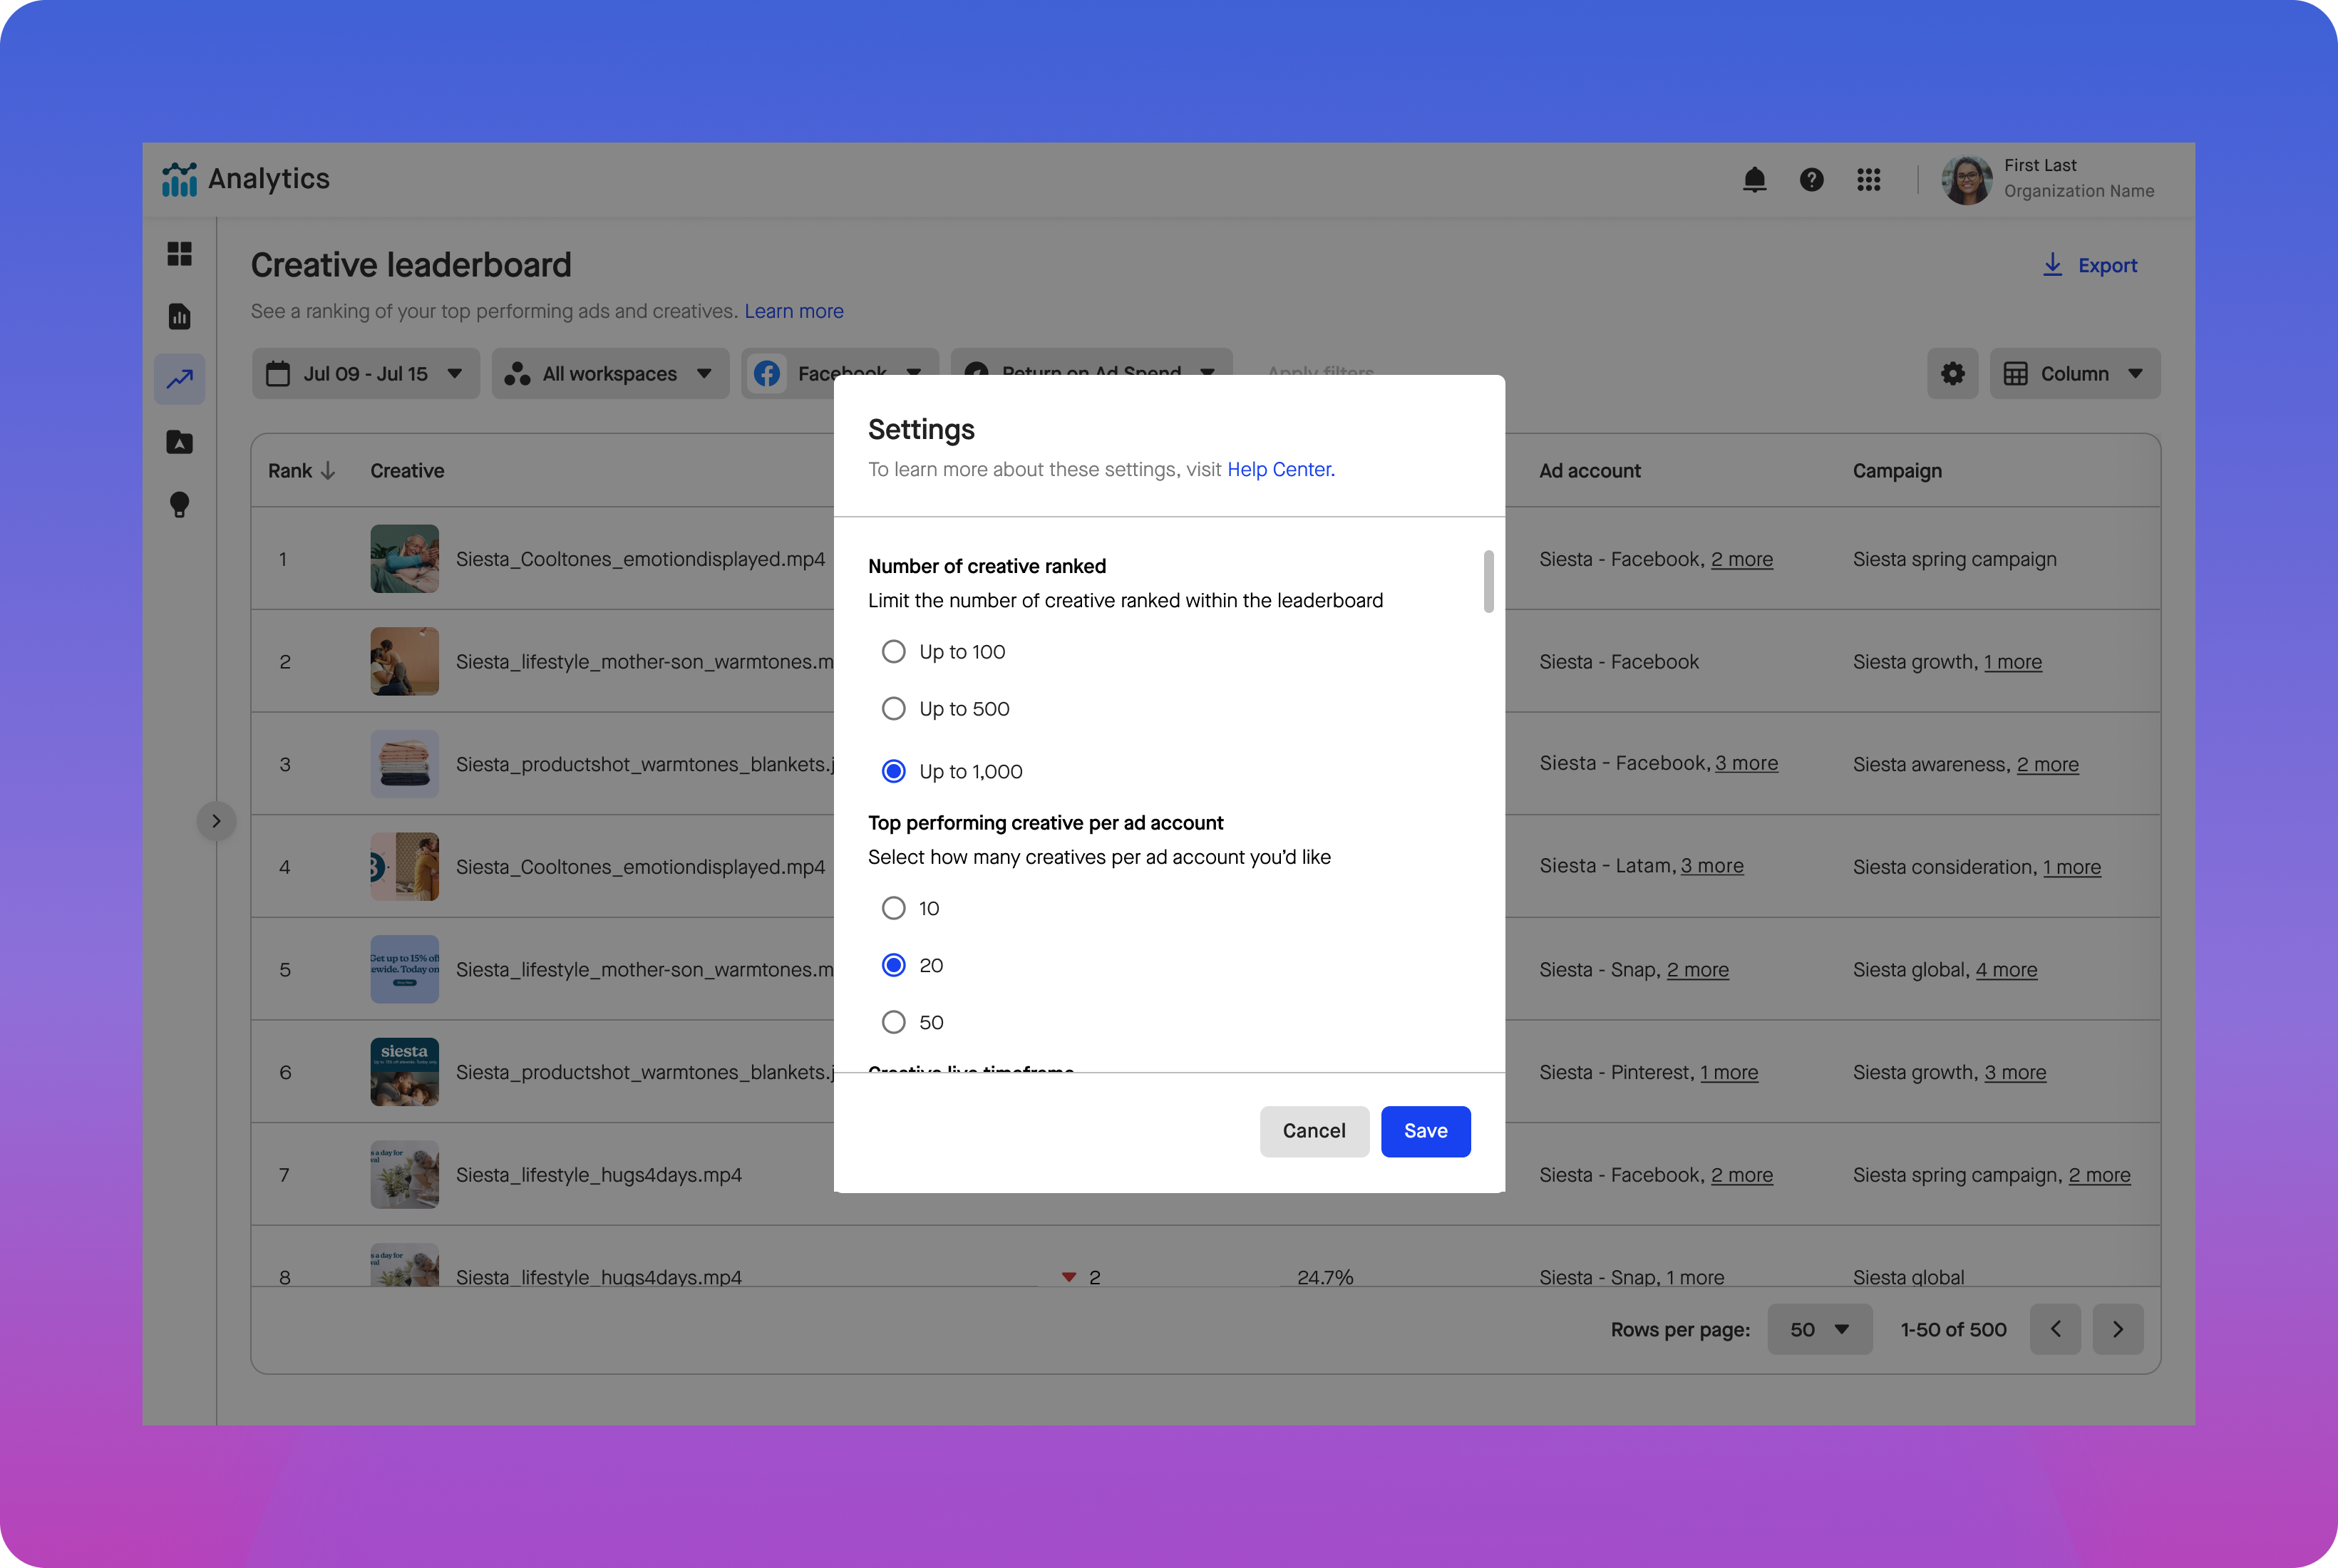
Settings modal
Prototype:
Results:
After the first month this new feature was live there were 7,433 unique page views with an average page view time of 8:12. This feature also led to a 22% refresh in creative for WPP's creative under the Coke brand.